注意
前往結尾以下載完整的範例程式碼。
GridSpec 範例#
此範例示範如何使用 GridSpec 來產生子圖、使用 *width_ratios* 和 *height_ratios* 控制子圖的相對大小,以及使用子圖參數(*left*、*right*、*bottom*、*top*、*wspace* 和 *hspace*)控制子圖周圍和之間的間距。
import matplotlib.pyplot as plt

from matplotlib.gridspec import GridSpec


def annotate_axes(fig):
    for i, ax in enumerate(fig.axes):
        ax.text(0.5, 0.5, "ax%d" % (i+1), va="center", ha="center")
        ax.tick_params(labelbottom=False, labelleft=False)


fig = plt.figure()
fig.suptitle("Controlling subplot sizes with width_ratios and height_ratios")

gs = GridSpec(2, 2, width_ratios=[1, 2], height_ratios=[4, 1])
ax1 = fig.add_subplot(gs[0])
ax2 = fig.add_subplot(gs[1])
ax3 = fig.add_subplot(gs[2])
ax4 = fig.add_subplot(gs[3])

annotate_axes(fig)
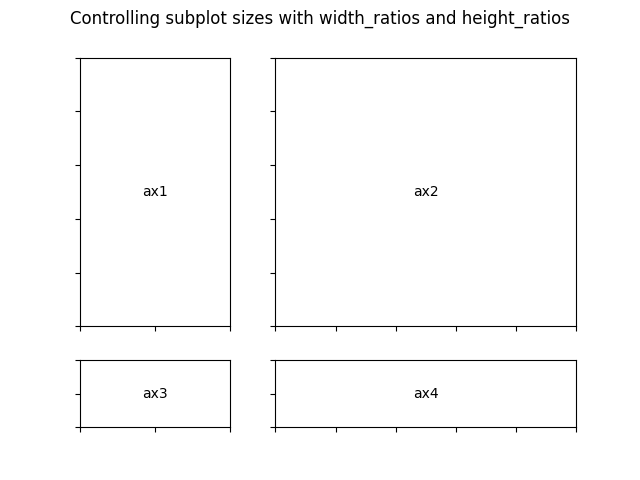
fig = plt.figure()
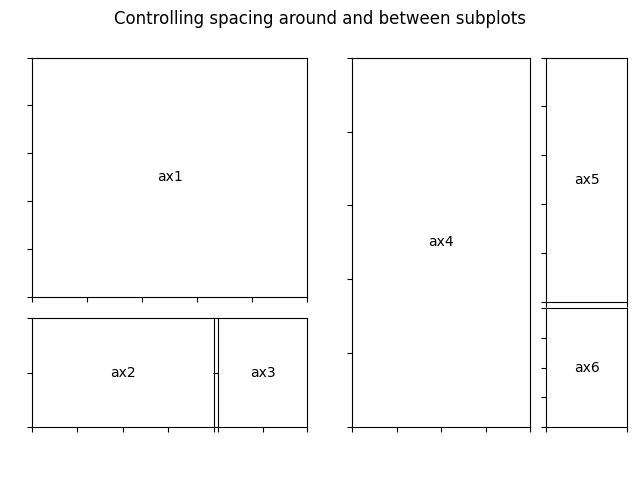
fig.suptitle("Controlling spacing around and between subplots")
gs1 = GridSpec(3, 3, left=0.05, right=0.48, wspace=0.05)
ax1 = fig.add_subplot(gs1[:-1, :])
ax2 = fig.add_subplot(gs1[-1, :-1])
ax3 = fig.add_subplot(gs1[-1, -1])
gs2 = GridSpec(3, 3, left=0.55, right=0.98, hspace=0.05)
ax4 = fig.add_subplot(gs2[:, :-1])
ax5 = fig.add_subplot(gs2[:-1, -1])
ax6 = fig.add_subplot(gs2[-1, -1])
annotate_axes(fig)
plt.show()