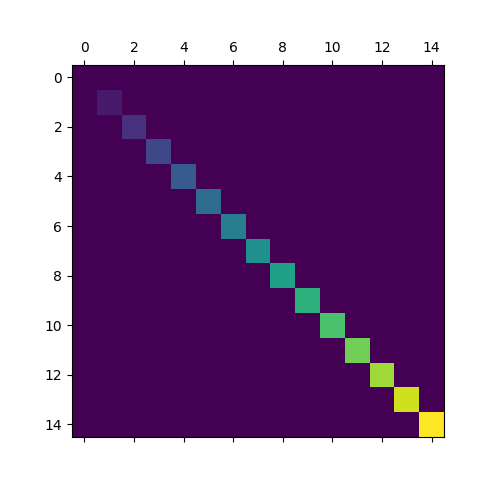
注意 前往結尾以下載完整的範例程式碼。 使用 matshow 可視化矩陣# matshow 將 2D 矩陣或陣列視覺化為彩色編碼影像。 import matplotlib.pyplot as plt import numpy as np # a 2D array with linearly increasing values on the diagonal a = np.diag(range(15)) plt.matshow(a) plt.show() 參考資料 此範例中顯示了以下函數、方法、類別和模組的使用 matplotlib.axes.Axes.imshow / matplotlib.pyplot.imshow 由 Sphinx-Gallery 產生的圖庫