注意
前往結尾下載完整範例程式碼。
自訂 Rc#
我這裡不是要製作一個好看的圖形,只是要展示一些在執行時自訂 rcParams 的範例。
如果您喜歡互動式工作,並且需要為圖形建立不同的預設值集合(例如,一組用於發佈的預設值,一組用於互動式探索的預設值),您可能需要在自訂模組中定義一些設定預設值的函式,例如:
def set_pub():
    rcParams.update({
        "font.weight": "bold",  # bold fonts
        "tick.labelsize": 15,   # large tick labels
        "lines.linewidth": 1,   # thick lines
        "lines.color": "k",     # black lines
        "grid.color": "0.5",    # gray gridlines
        "grid.linestyle": "-",  # solid gridlines
        "grid.linewidth": 0.5,  # thin gridlines
        "savefig.dpi": 300,     # higher resolution output.
    })
然後在您以互動方式工作時,只需要執行
>>> set_pub()
>>> plot([1, 2, 3])
>>> savefig('myfig')
>>> rcdefaults()  # restore the defaults
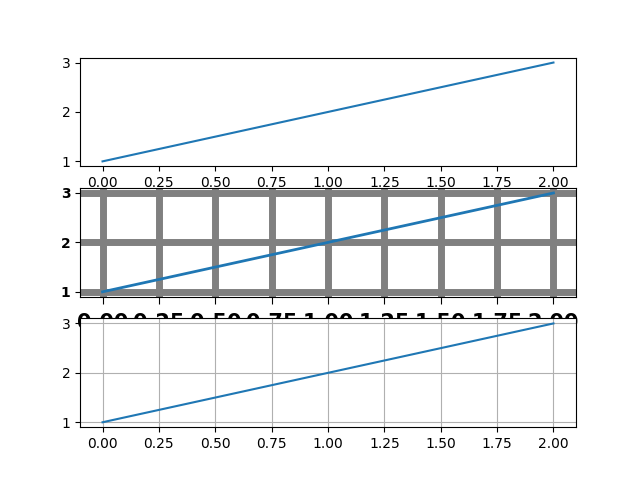
import matplotlib.pyplot as plt

plt.subplot(311)
plt.plot([1, 2, 3])

# the axes attributes need to be set before the call to subplot
plt.rcParams.update({
    "font.weight": "bold",
    "xtick.major.size": 5,
    "xtick.major.pad": 7,
    "xtick.labelsize": 15,
    "grid.color": "0.5",
    "grid.linestyle": "-",
    "grid.linewidth": 5,
    "lines.linewidth": 2,
    "lines.color": "g",
})
plt.subplot(312)
plt.plot([1, 2, 3])
plt.grid(True)

plt.rcdefaults()
plt.subplot(313)
plt.plot([1, 2, 3])
plt.grid(True)
plt.show()