註記
前往末尾以下載完整的範例程式碼。
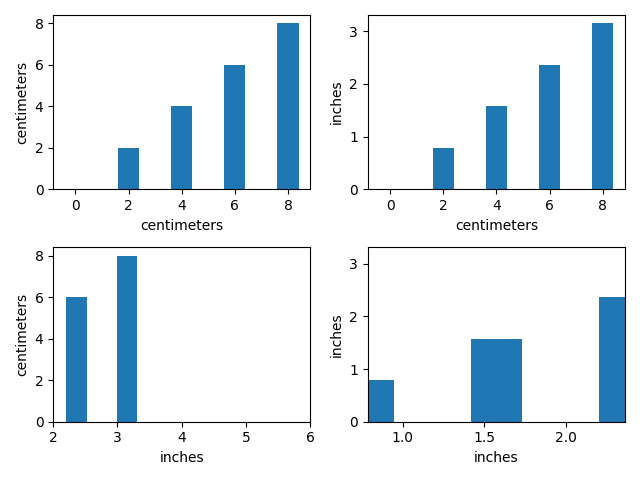
具有單位的長條圖演示#
使用各種公分和英寸轉換的繪圖。此範例顯示預設單位內省如何運作 (ax1)、如何使用各種關鍵字設定 x 和 y 單位以覆寫預設值 (ax2, ax3, ax4),以及如何使用純量 (ax3, 假設為目前單位) 或單位 (轉換應用於取得目前單位的值) 設定 x 限制。
此範例需要 basic_units.py
from basic_units import cm, inch

import matplotlib.pyplot as plt
import numpy as np

cms = cm * np.arange(0, 10, 2)
bottom = 0 * cm
width = 0.8 * cm

fig, axs = plt.subplots(2, 2)

axs[0, 0].bar(cms, cms, bottom=bottom)

axs[0, 1].bar(cms, cms, bottom=bottom, width=width, xunits=cm, yunits=inch)

axs[1, 0].bar(cms, cms, bottom=bottom, width=width, xunits=inch, yunits=cm)
axs[1, 0].set_xlim(2, 6)  # scalars are interpreted in current units

axs[1, 1].bar(cms, cms, bottom=bottom, width=width, xunits=inch, yunits=inch)
axs[1, 1].set_xlim(2 * cm, 6 * cm)  # cm are converted to inches

fig.tight_layout()
plt.show()