注意
前往結尾以下載完整的範例程式碼。
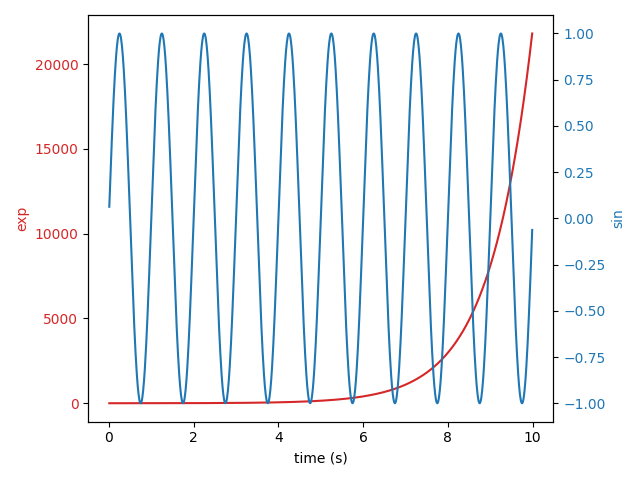
具有不同刻度的圖形#
同一軸上具有不同左右刻度的兩個圖形。
訣竅是使用*兩個不同的軸*,它們共享相同的*x*軸。您可以根據需要使用單獨的 matplotlib.ticker 格式化器和定位器,因為這兩個軸是獨立的。
此類軸是透過呼叫 Axes.twinx 方法產生。同樣地,Axes.twiny 可用於產生共享*y*軸,但具有不同頂部和底部刻度的軸。
import matplotlib.pyplot as plt
import numpy as np

# Create some mock data
t = np.arange(0.01, 10.0, 0.01)
data1 = np.exp(t)
data2 = np.sin(2 * np.pi * t)

fig, ax1 = plt.subplots()

color = 'tab:red'
ax1.set_xlabel('time (s)')
ax1.set_ylabel('exp', color=color)
ax1.plot(t, data1, color=color)
ax1.tick_params(axis='y', labelcolor=color)

ax2 = ax1.twinx()  # instantiate a second Axes that shares the same x-axis

color = 'tab:blue'
ax2.set_ylabel('sin', color=color)  # we already handled the x-label with ax1
ax2.plot(t, data2, color=color)
ax2.tick_params(axis='y', labelcolor=color)

fig.tight_layout()  # otherwise the right y-label is slightly clipped
plt.show()
參考文獻
本範例中顯示了以下函數、方法、類別和模組的使用方式
腳本總執行時間: (0 分鐘 1.139 秒)