注意
前往結尾以下載完整的範例程式碼。
進階箭頭和箭頭鍵函式#
示範quiver的一些更進階選項。如需簡單範例,請參閱箭頭簡單示範。
注意:圖表自動縮放不會將箭頭納入考量,因此邊界上的箭頭可能會超出圖片範圍。這不是一個可以完美解決的普遍問題。建議的解決方法是在這種情況下手動設定軸限制。
fig1, ax1 = plt.subplots()
ax1.set_title('Arrows scale with plot width, not view')
Q = ax1.quiver(X, Y, U, V, units='width')
qk = ax1.quiverkey(Q, 0.9, 0.9, 2, r'$2 \frac{m}{s}$', labelpos='E',
                   coordinates='figure')
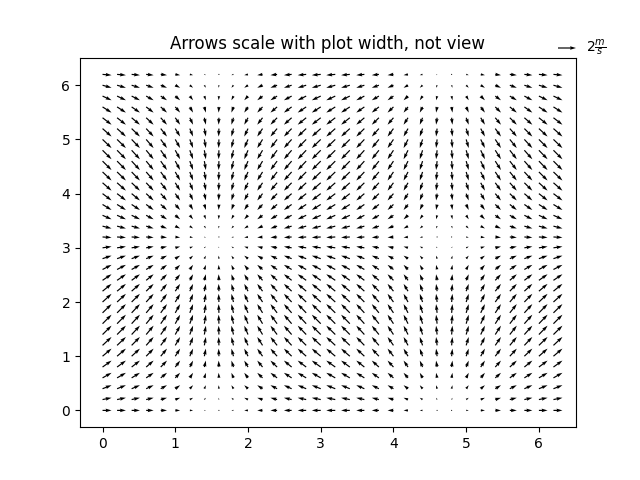
fig2, ax2 = plt.subplots()
ax2.set_title("pivot='mid'; every third arrow; units='inches'")
Q = ax2.quiver(X[::3, ::3], Y[::3, ::3], U[::3, ::3], V[::3, ::3],
               pivot='mid', units='inches')
qk = ax2.quiverkey(Q, 0.9, 0.9, 1, r'$1 \frac{m}{s}$', labelpos='E',
                   coordinates='figure')
ax2.scatter(X[::3, ::3], Y[::3, ::3], color='r', s=5)
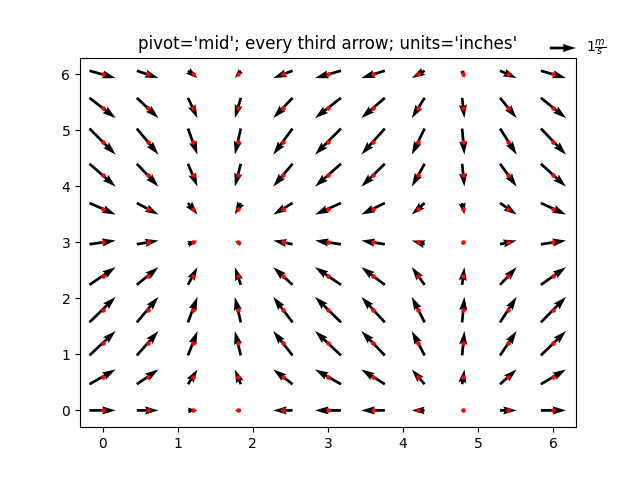
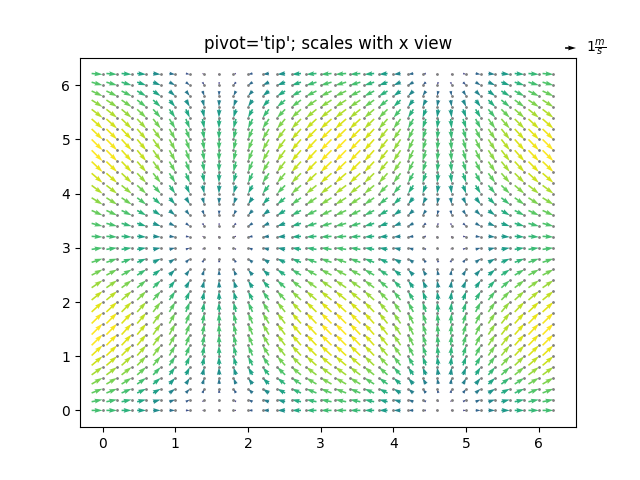
fig3, ax3 = plt.subplots()
ax3.set_title("pivot='tip'; scales with x view")
M = np.hypot(U, V)
Q = ax3.quiver(X, Y, U, V, M, units='x', pivot='tip', width=0.022,
               scale=1 / 0.15)
qk = ax3.quiverkey(Q, 0.9, 0.9, 1, r'$1 \frac{m}{s}$', labelpos='E',
                   coordinates='figure')
ax3.scatter(X, Y, color='0.5', s=1)

plt.show()
參考資料
本範例中顯示了以下函式、方法、類別和模組的使用
腳本的總執行時間:(0 分鐘 3.643 秒)