注意
跳至結尾以下載完整的範例程式碼。
Zorder 演示#
藝術家的繪圖順序由其 zorder 屬性決定,該屬性是浮點數。具有較高 zorder 的藝術家會在頂部繪製。您可以透過設定個別藝術家的 zorder 來變更其順序。預設值取決於藝術家的類型
藝術家 |
Z 順序 |
|---|---|
0 |
|
1 |
|
|
2 |
主要刻度 |
2.01 |
|
3 |
5 |
任何對繪圖方法的呼叫都可以明確設定該特定項目的 zorder 值。
注意
set_axisbelow 和 rcParams["axes.axisbelow"] (預設值:'line')是設定刻度和網格線 zorder 的方便輔助工具。
繪圖是每次對一個 Axes 執行。如果您有重疊的軸,則第二個軸的所有元素都會繪製在第一個軸的頂部,無論它們的相對 zorder 如何。
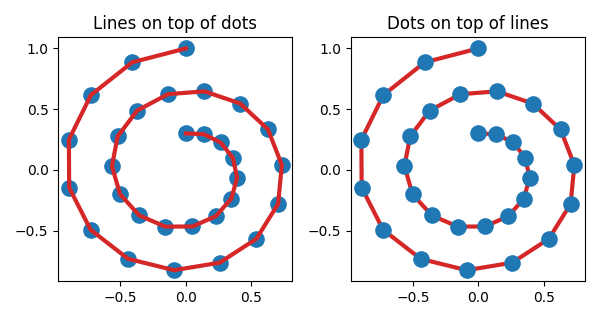
以下範例包含由 plot() 建立的 Line2D,以及由 scatter() 建立的點(PatchCollection)。因此,預設情況下,點位於線條下方(第一個子圖)。在第二個子圖中,明確設定 zorder 以將點移動到線條上方。
fig, (ax1, ax2) = plt.subplots(1, 2, figsize=(6, 3.2))

ax1.plot(x, y, 'C3', lw=3)
ax1.scatter(x, y, s=120)
ax1.set_title('Lines on top of dots')

ax2.plot(x, y, 'C3', lw=3)
ax2.scatter(x, y, s=120, zorder=2.5)  # move dots on top of line
ax2.set_title('Dots on top of lines')

plt.tight_layout()
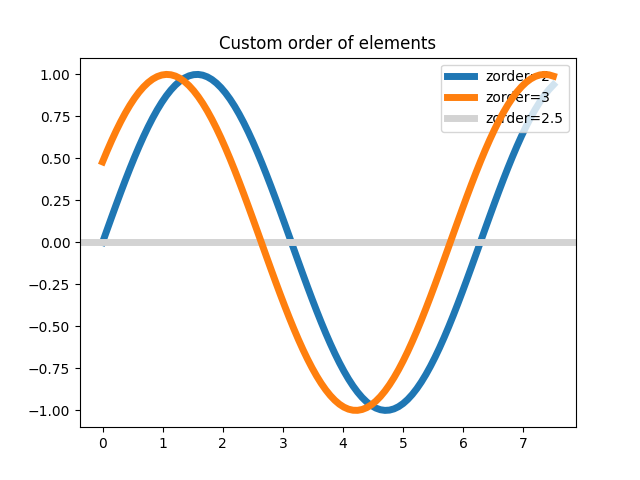
許多建立可見物件的函式都接受 zorder 參數。或者,您可以在稍後於建立的物件上呼叫 set_zorder()。
x = np.linspace(0, 7.5, 100)
plt.rcParams['lines.linewidth'] = 5
plt.figure()
plt.plot(x, np.sin(x), label='zorder=2', zorder=2)  # bottom
plt.plot(x, np.sin(x+0.5), label='zorder=3',  zorder=3)
plt.axhline(0, label='zorder=2.5', color='lightgrey', zorder=2.5)
plt.title('Custom order of elements')
l = plt.legend(loc='upper right')
l.set_zorder(2.5)  # legend between blue and orange line
plt.show()
腳本總執行時間:(0 分鐘 1.299 秒)