注意
前往結尾以下載完整的範例程式碼。
日期刻度定位器和格式化器#
此範例說明各種日期定位器和格式化器的使用和效果。
import matplotlib.pyplot as plt
import numpy as np

from matplotlib.dates import (FR, MO, MONTHLY, SA, SU, TH, TU, WE,
                              AutoDateFormatter, AutoDateLocator,
                              ConciseDateFormatter, DateFormatter, DayLocator,
                              HourLocator, MicrosecondLocator, MinuteLocator,
                              MonthLocator, RRuleLocator, SecondLocator,
                              WeekdayLocator, YearLocator, rrulewrapper)
import matplotlib.ticker as ticker


def plot_axis(ax, locator=None, xmax='2002-02-01', fmt=None, formatter=None):
    """Set up common parameters for the Axes in the example."""
    ax.spines[['left', 'right', 'top']].set_visible(False)
    ax.yaxis.set_major_locator(ticker.NullLocator())
    ax.tick_params(which='major', width=1.00, length=5)
    ax.tick_params(which='minor', width=0.75, length=2.5)
    ax.set_xlim(np.datetime64('2000-02-01'), np.datetime64(xmax))
    if locator:
        ax.xaxis.set_major_locator(eval(locator))
        ax.xaxis.set_major_formatter(DateFormatter(fmt))
    else:
        ax.xaxis.set_major_formatter(eval(formatter))
    ax.text(0.0, 0.2, locator or formatter, transform=ax.transAxes,
            fontsize=14, fontname='Monospace', color='tab:blue')
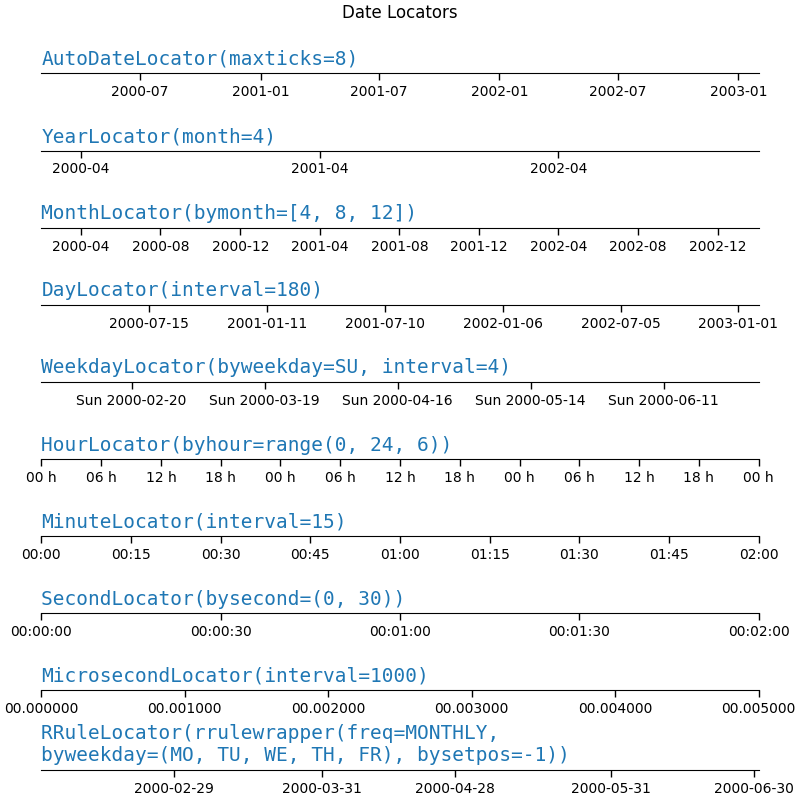
日期刻度定位器#
locators = [
    # locator as str, xmax, fmt
    ('AutoDateLocator(maxticks=8)', '2003-02-01', '%Y-%m'),
    ('YearLocator(month=4)', '2003-02-01', '%Y-%m'),
    ('MonthLocator(bymonth=[4, 8, 12])', '2003-02-01', '%Y-%m'),
    ('DayLocator(interval=180)', '2003-02-01', '%Y-%m-%d'),
    ('WeekdayLocator(byweekday=SU, interval=4)', '2000-07-01', '%a %Y-%m-%d'),
    ('HourLocator(byhour=range(0, 24, 6))', '2000-02-04', '%H h'),
    ('MinuteLocator(interval=15)', '2000-02-01 02:00', '%H:%M'),
    ('SecondLocator(bysecond=(0, 30))', '2000-02-01 00:02', '%H:%M:%S'),
    ('MicrosecondLocator(interval=1000)', '2000-02-01 00:00:00.005', '%S.%f'),
    ('RRuleLocator(rrulewrapper(freq=MONTHLY, \nbyweekday=(MO, TU, WE, TH, FR), '
     'bysetpos=-1))', '2000-07-01', '%Y-%m-%d'),
]

fig, axs = plt.subplots(len(locators), 1, figsize=(8, len(locators) * .8),
                        layout='constrained')
fig.suptitle('Date Locators')
for ax, (locator, xmax, fmt) in zip(axs, locators):
    plot_axis(ax, locator, xmax, fmt)
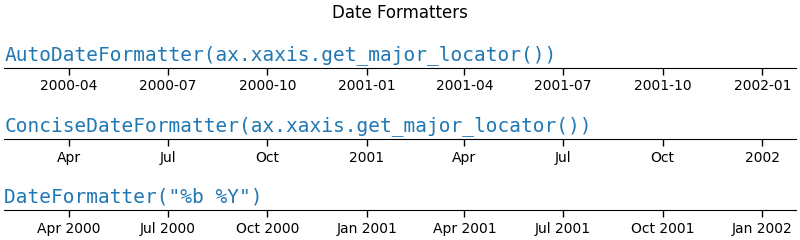
日期格式化器#
formatters = [
    'AutoDateFormatter(ax.xaxis.get_major_locator())',
    'ConciseDateFormatter(ax.xaxis.get_major_locator())',
    'DateFormatter("%b %Y")',
]

fig, axs = plt.subplots(len(formatters), 1, figsize=(8, len(formatters) * .8),
                        layout='constrained')
fig.suptitle('Date Formatters')
for ax, fmt in zip(axs, formatters):
    plot_axis(ax, formatter=fmt)
參考文獻
此範例顯示了以下函數、方法、類別和模組的使用
腳本的總執行時間: (0 分 4.031 秒)