注意
前往末尾下載完整範例程式碼。
堆疊圖和河流圖#
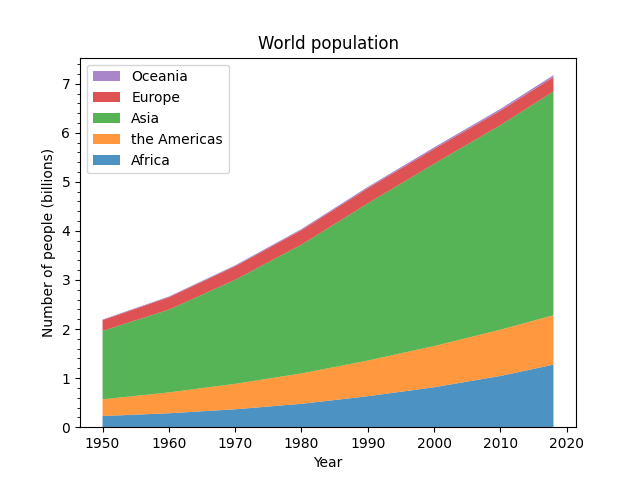
堆疊圖#
堆疊圖將多個資料集繪製為垂直堆疊的區域。當個別資料值以及其累積值都令人感興趣時,這非常有用。
import matplotlib.pyplot as plt
import numpy as np

import matplotlib.ticker as mticker

# data from United Nations World Population Prospects (Revision 2019)
# https://population.un.org/wpp/, license: CC BY 3.0 IGO
year = [1950, 1960, 1970, 1980, 1990, 2000, 2010, 2018]
population_by_continent = {
    'Africa': [.228, .284, .365, .477, .631, .814, 1.044, 1.275],
    'the Americas': [.340, .425, .519, .619, .727, .840, .943, 1.006],
    'Asia': [1.394, 1.686, 2.120, 2.625, 3.202, 3.714, 4.169, 4.560],
    'Europe': [.220, .253, .276, .295, .310, .303, .294, .293],
    'Oceania': [.012, .015, .019, .022, .026, .031, .036, .039],
}

fig, ax = plt.subplots()
ax.stackplot(year, population_by_continent.values(),
             labels=population_by_continent.keys(), alpha=0.8)
ax.legend(loc='upper left', reverse=True)
ax.set_title('World population')
ax.set_xlabel('Year')
ax.set_ylabel('Number of people (billions)')
# add tick at every 200 million people
ax.yaxis.set_minor_locator(mticker.MultipleLocator(.2))

plt.show()
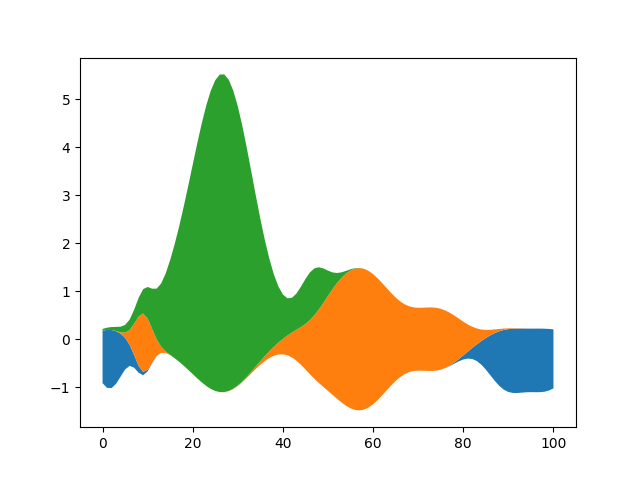
河流圖#
使用 *baseline* 參數,您可以將基準為 0 的普通堆疊面積圖轉換為河流圖。
# Fixing random state for reproducibility
np.random.seed(19680801)


def gaussian_mixture(x, n=5):
    """Return a random mixture of *n* Gaussians, evaluated at positions *x*."""
    def add_random_gaussian(a):
        amplitude = 1 / (.1 + np.random.random())
        dx = x[-1] - x[0]
        x0 = (2 * np.random.random() - .5) * dx
        z = 10 / (.1 + np.random.random()) / dx
        a += amplitude * np.exp(-(z * (x - x0))**2)
    a = np.zeros_like(x)
    for j in range(n):
        add_random_gaussian(a)
    return a


x = np.linspace(0, 100, 101)
ys = [gaussian_mixture(x) for _ in range(3)]

fig, ax = plt.subplots()
ax.stackplot(x, ys, baseline='wiggle')
plt.show()
腳本總執行時間: (0 分 1.643 秒)