注意
前往結尾以下載完整的範例程式碼。
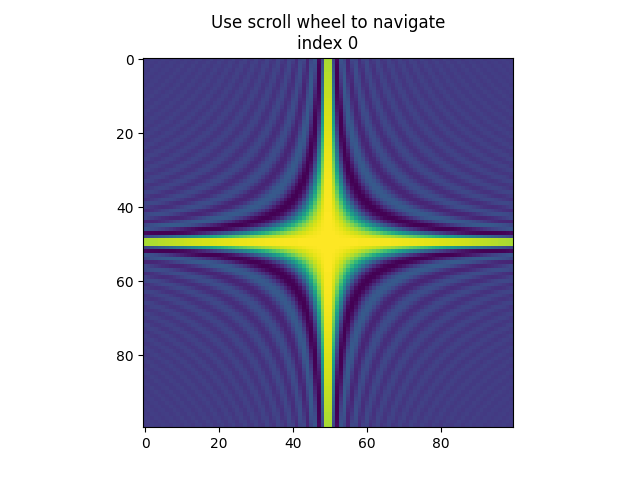
滾動事件#
在此範例中,滾輪事件用於滾動瀏覽 3D 資料的 2D 切片。
注意
此範例練習 Matplotlib 的互動功能,這不會出現在靜態文件中。請在您的機器上執行此程式碼以查看互動效果。
您可以複製並貼上個別部分,或使用頁面底部的連結下載整個範例。
import matplotlib.pyplot as plt
import numpy as np


class IndexTracker:
    def __init__(self, ax, X):
        self.index = 0
        self.X = X
        self.ax = ax
        self.im = ax.imshow(self.X[:, :, self.index])
        self.update()

    def on_scroll(self, event):
        print(event.button, event.step)
        increment = 1 if event.button == 'up' else -1
        max_index = self.X.shape[-1] - 1
        self.index = np.clip(self.index + increment, 0, max_index)
        self.update()

    def update(self):
        self.im.set_data(self.X[:, :, self.index])
        self.ax.set_title(
            f'Use scroll wheel to navigate\nindex {self.index}')
        self.im.axes.figure.canvas.draw()


x, y, z = np.ogrid[-10:10:100j, -10:10:100j, 1:10:20j]
X = np.sin(x * y * z) / (x * y * z)

fig, ax = plt.subplots()
# create an IndexTracker and make sure it lives during the whole
# lifetime of the figure by assigning it to a variable
tracker = IndexTracker(ax, X)

fig.canvas.mpl_connect('scroll_event', tracker.on_scroll)
plt.show()