注意
前往結尾以下載完整範例程式碼。
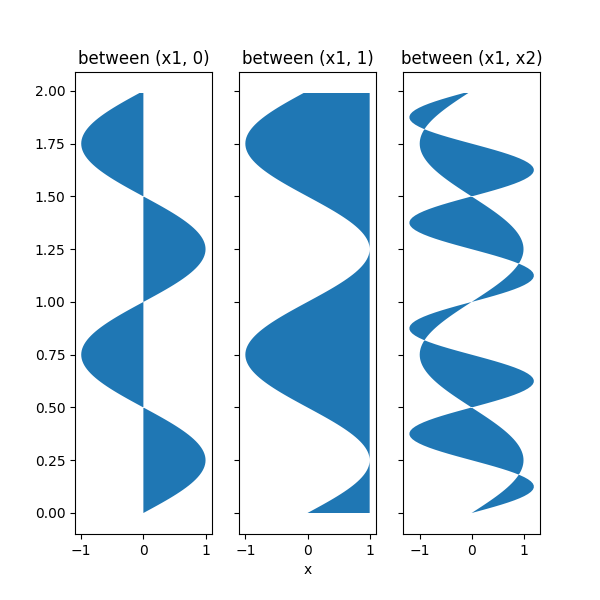
填滿兩條垂直線之間的區域#
使用 fill_betweenx 在兩條曲線之間沿水平方向著色。
import matplotlib.pyplot as plt
import numpy as np

y = np.arange(0.0, 2, 0.01)
x1 = np.sin(2 * np.pi * y)
x2 = 1.2 * np.sin(4 * np.pi * y)

fig, [ax1, ax2, ax3] = plt.subplots(1, 3, sharey=True, figsize=(6, 6))

ax1.fill_betweenx(y, 0, x1)
ax1.set_title('between (x1, 0)')

ax2.fill_betweenx(y, x1, 1)
ax2.set_title('between (x1, 1)')
ax2.set_xlabel('x')

ax3.fill_betweenx(y, x1, x2)
ax3.set_title('between (x1, x2)')
現在填滿 x1 和 x2 之間,其中滿足邏輯條件。請注意,這與呼叫不同
因為多個連續區域上的邊緣效應。
fig, [ax, ax1] = plt.subplots(1, 2, sharey=True, figsize=(6, 6))
ax.plot(x1, y, x2, y, color='black')
ax.fill_betweenx(y, x1, x2, where=x2 >= x1, facecolor='green')
ax.fill_betweenx(y, x1, x2, where=x2 <= x1, facecolor='red')
ax.set_title('fill_betweenx where')

# Test support for masked arrays.
x2 = np.ma.masked_greater(x2, 1.0)
ax1.plot(x1, y, x2, y, color='black')
ax1.fill_betweenx(y, x1, x2, where=x2 >= x1, facecolor='green')
ax1.fill_betweenx(y, x1, x2, where=x2 <= x1, facecolor='red')
ax1.set_title('regions with x2 > 1 are masked')
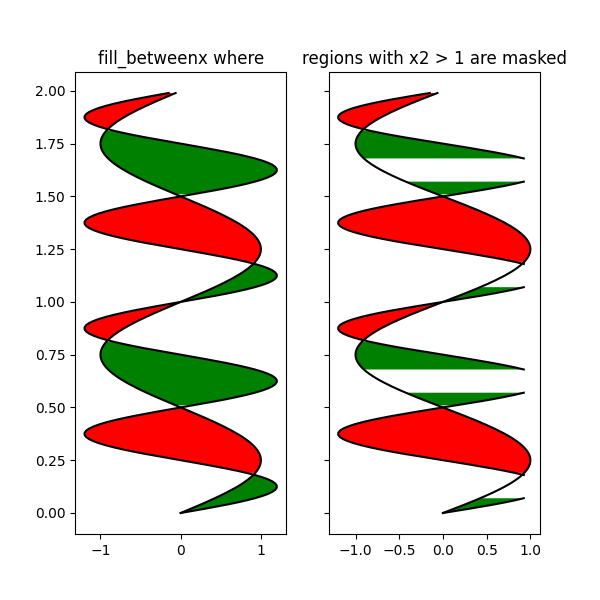
此範例說明了一個問題;由於資料格點化,在交叉點處會出現不希望有的未填滿三角形。暴力解法是在繪圖前將所有陣列插值到非常精細的網格。
plt.show()
指令碼的總執行時間: (0 分鐘 2.374 秒)