注意
前往末尾下載完整的範例程式碼。
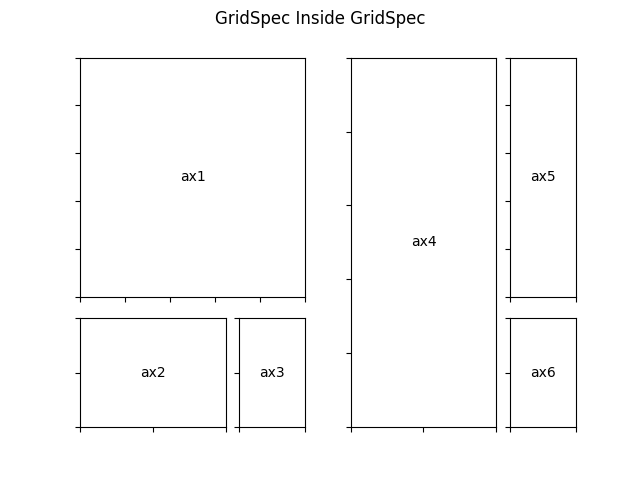
巢狀 GridSpecs#
GridSpecs 可以巢狀化,因此來自父 GridSpec 的子圖可以設定巢狀子圖網格的位置。
請注意,使用 subfigures 可以更直接地實現相同的功能;請參閱 圖表子圖。
import matplotlib.pyplot as plt

import matplotlib.gridspec as gridspec


def format_axes(fig):
    for i, ax in enumerate(fig.axes):
        ax.text(0.5, 0.5, "ax%d" % (i+1), va="center", ha="center")
        ax.tick_params(labelbottom=False, labelleft=False)


# gridspec inside gridspec
fig = plt.figure()

gs0 = gridspec.GridSpec(1, 2, figure=fig)

gs00 = gridspec.GridSpecFromSubplotSpec(3, 3, subplot_spec=gs0[0])

ax1 = fig.add_subplot(gs00[:-1, :])
ax2 = fig.add_subplot(gs00[-1, :-1])
ax3 = fig.add_subplot(gs00[-1, -1])

# the following syntax does the same as the GridSpecFromSubplotSpec call above:
gs01 = gs0[1].subgridspec(3, 3)

ax4 = fig.add_subplot(gs01[:, :-1])
ax5 = fig.add_subplot(gs01[:-1, -1])
ax6 = fig.add_subplot(gs01[-1, -1])

plt.suptitle("GridSpec Inside GridSpec")
format_axes(fig)

plt.show()