注意事項
跳至結尾以下載完整的範例程式碼。
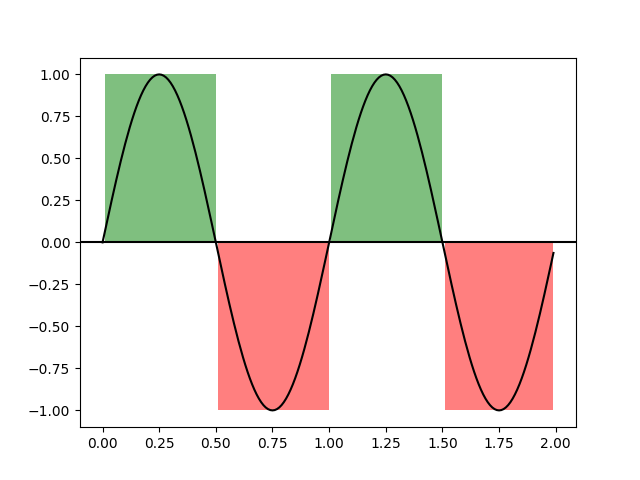
使用 fill_between 著色由邏輯遮罩定義的區域#
import matplotlib.pyplot as plt
import numpy as np

t = np.arange(0.0, 2, 0.01)
s = np.sin(2*np.pi*t)

fig, ax = plt.subplots()

ax.plot(t, s, color='black')
ax.axhline(0, color='black')

ax.fill_between(t, 1, where=s > 0, facecolor='green', alpha=.5)
ax.fill_between(t, -1, where=s < 0, facecolor='red', alpha=.5)

plt.show()