注意
前往結尾以下載完整的範例程式碼。
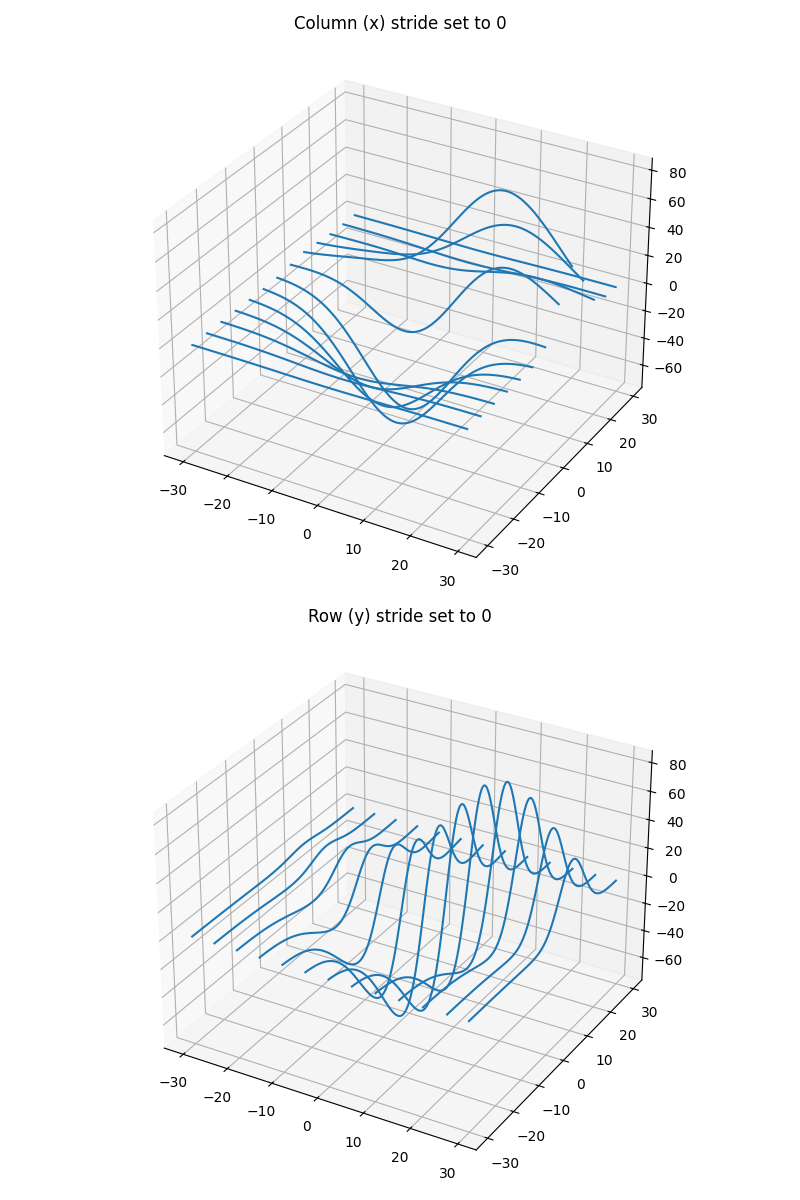
單方向的 3D 線框圖#
示範將 rstride 或 cstride 設定為 0 會導致在相應方向不產生線條。
import matplotlib.pyplot as plt

from mpl_toolkits.mplot3d import axes3d

fig, (ax1, ax2) = plt.subplots(
    2, 1, figsize=(8, 12), subplot_kw={'projection': '3d'})

# Get the test data
X, Y, Z = axes3d.get_test_data(0.05)

# Give the first plot only wireframes of the type y = c
ax1.plot_wireframe(X, Y, Z, rstride=10, cstride=0)
ax1.set_title("Column (x) stride set to 0")

# Give the second plot only wireframes of the type x = c
ax2.plot_wireframe(X, Y, Z, rstride=0, cstride=10)
ax2.set_title("Row (y) stride set to 0")

plt.tight_layout()
plt.show()
指令碼總執行時間: (0 分鐘 2.043 秒)