注意
前往結尾 以下載完整的範例程式碼。
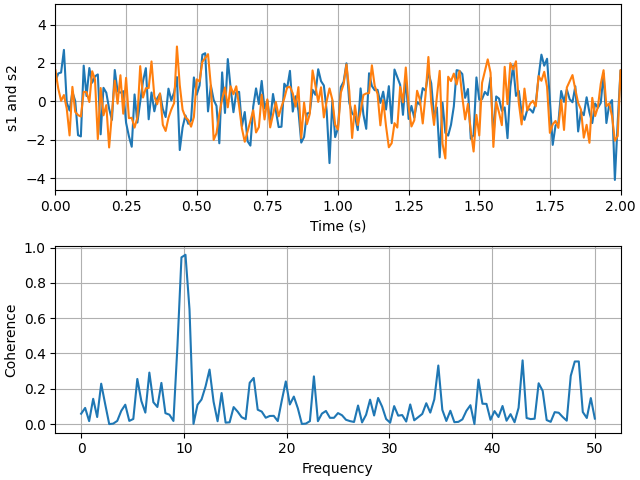
繪製兩個訊號的同調性#
一個範例展示如何使用 cohere 繪製兩個訊號的同調性。
import matplotlib.pyplot as plt
import numpy as np

# Fixing random state for reproducibility
np.random.seed(19680801)

dt = 0.01
t = np.arange(0, 30, dt)
nse1 = np.random.randn(len(t))                 # white noise 1
nse2 = np.random.randn(len(t))                 # white noise 2

# Two signals with a coherent part at 10 Hz and a random part
s1 = np.sin(2 * np.pi * 10 * t) + nse1
s2 = np.sin(2 * np.pi * 10 * t) + nse2

fig, axs = plt.subplots(2, 1, layout='constrained')
axs[0].plot(t, s1, t, s2)
axs[0].set_xlim(0, 2)
axs[0].set_xlabel('Time (s)')
axs[0].set_ylabel('s1 and s2')
axs[0].grid(True)

cxy, f = axs[1].cohere(s1, s2, NFFT=256, Fs=1. / dt)
axs[1].set_ylabel('Coherence')

plt.show()
腳本總執行時間: (0 分鐘 1.959 秒)