注意
前往末尾下載完整的範例程式碼。
日期精確度和紀元#
Matplotlib 可以處理 datetime 物件和 numpy.datetime64 物件,使用可辨識這些日期並將其轉換為浮點數的單位轉換器。
在 Matplotlib 3.3 之前,此轉換的預設值會傳回一個浮點數,該浮點數是自「0000-12-31T00:00:00」以來的日期。從 Matplotlib 3.3 開始,預設值是自「1970-01-01T00:00:00」以來的日期。這允許現代日期有更高的解析度。「2020-01-01」使用舊紀元會轉換為 730120,而 64 位元浮點數的解析度為 2^{-52},大約為 14 微秒,因此會遺失微秒精確度。使用新的預設紀元,「2020-01-01」為 10957.0,因此可達成的解析度為 0.21 微秒。
import datetime

import matplotlib.pyplot as plt
import numpy as np

import matplotlib.dates as mdates


def _reset_epoch_for_tutorial():
    """
    Users (and downstream libraries) should not use the private method of
    resetting the epoch.
    """
    mdates._reset_epoch_test_example()
Datetime#
Python datetime 物件具有微秒解析度,因此使用舊的預設值,matplotlib 無法來回傳遞完整解析度的 datetime 物件。
old_epoch = '0000-12-31T00:00:00'
new_epoch = '1970-01-01T00:00:00'

_reset_epoch_for_tutorial()  # Don't do this.  Just for this tutorial.
mdates.set_epoch(old_epoch)  # old epoch (pre MPL 3.3)

date1 = datetime.datetime(2000, 1, 1, 0, 10, 0, 12,
                          tzinfo=datetime.timezone.utc)
mdate1 = mdates.date2num(date1)
print('Before Roundtrip: ', date1, 'Matplotlib date:', mdate1)
date2 = mdates.num2date(mdate1)
print('After Roundtrip:  ', date2)
Before Roundtrip:  2000-01-01 00:10:00.000012+00:00 Matplotlib date: 730120.0069444446
After Roundtrip:   2000-01-01 00:10:00.000020+00:00
請注意,這只是一個捨入誤差,而且對於更接近舊紀元的日期沒有問題。
date1 = datetime.datetime(10, 1, 1, 0, 10, 0, 12,
                          tzinfo=datetime.timezone.utc)
mdate1 = mdates.date2num(date1)
print('Before Roundtrip: ', date1, 'Matplotlib date:', mdate1)
date2 = mdates.num2date(mdate1)
print('After Roundtrip:  ', date2)
Before Roundtrip:  0010-01-01 00:10:00.000012+00:00 Matplotlib date: 3288.006944444583
After Roundtrip:   0010-01-01 00:10:00.000012+00:00
如果使用者想要以微秒精確度使用現代日期,可以使用 set_epoch 變更紀元。不過,必須在任何日期操作之前設定紀元,以防止不同紀元之間產生混淆。嘗試稍後變更紀元將引發 RuntimeError。
try:
    mdates.set_epoch(new_epoch)  # this is the new MPL 3.3 default.
except RuntimeError as e:
    print('RuntimeError:', str(e))
RuntimeError: set_epoch must be called before dates plotted.
在本教學課程中,我們使用私有方法重設哨兵,但使用者應只設定一次紀元(如果有的話)。
_reset_epoch_for_tutorial()  # Just being done for this tutorial.
mdates.set_epoch(new_epoch)

date1 = datetime.datetime(2020, 1, 1, 0, 10, 0, 12,
                          tzinfo=datetime.timezone.utc)
mdate1 = mdates.date2num(date1)
print('Before Roundtrip: ', date1, 'Matplotlib date:', mdate1)
date2 = mdates.num2date(mdate1)
print('After Roundtrip:  ', date2)
Before Roundtrip:  2020-01-01 00:10:00.000012+00:00 Matplotlib date: 18262.006944444583
After Roundtrip:   2020-01-01 00:10:00.000012+00:00
datetime64#
numpy.datetime64 物件的微秒精確度時間空間遠大於 datetime 物件。不過,目前 Matplotlib 時間僅轉換回 datetime 物件,後者具有微秒解析度,以及僅跨越 0000 到 9999 的年份。
_reset_epoch_for_tutorial()  # Don't do this.  Just for this tutorial.
mdates.set_epoch(new_epoch)

date1 = np.datetime64('2000-01-01T00:10:00.000012')
mdate1 = mdates.date2num(date1)
print('Before Roundtrip: ', date1, 'Matplotlib date:', mdate1)
date2 = mdates.num2date(mdate1)
print('After Roundtrip:  ', date2)
Before Roundtrip:  2000-01-01T00:10:00.000012 Matplotlib date: 10957.006944444583
After Roundtrip:   2000-01-01 00:10:00.000012+00:00
繪圖#
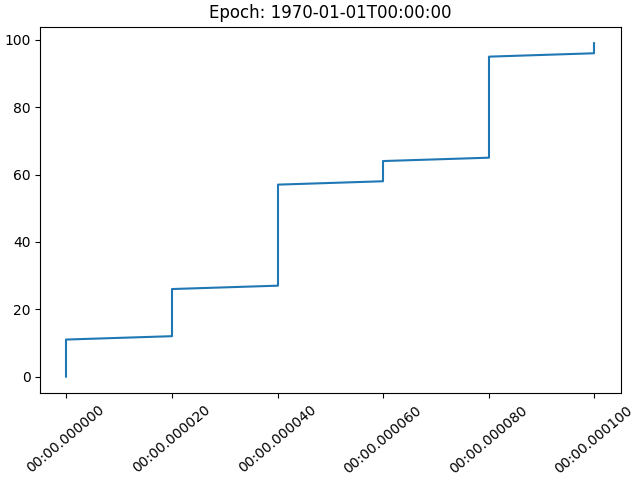
這一切當然會影響繪圖。使用舊的預設紀元,時間會在內部 date2num 轉換期間四捨五入,導致資料跳躍。
_reset_epoch_for_tutorial()  # Don't do this.  Just for this tutorial.
mdates.set_epoch(old_epoch)

x = np.arange('2000-01-01T00:00:00.0', '2000-01-01T00:00:00.000100',
              dtype='datetime64[us]')
# simulate the plot being made using the old epoch
xold = np.array([mdates.num2date(mdates.date2num(d)) for d in x])
y = np.arange(0, len(x))

# resetting the Epoch so plots are comparable
_reset_epoch_for_tutorial()  # Don't do this.  Just for this tutorial.
mdates.set_epoch(new_epoch)

fig, ax = plt.subplots(layout='constrained')
ax.plot(xold, y)
ax.set_title('Epoch: ' + mdates.get_epoch())
ax.xaxis.set_tick_params(rotation=40)
plt.show()
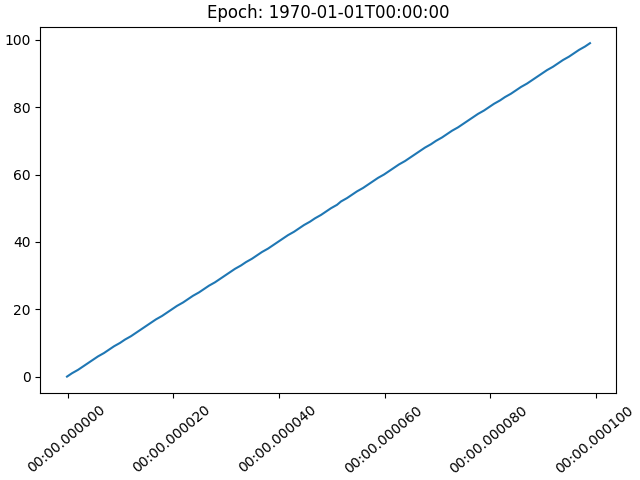
對於使用較新紀元繪製的日期,圖形是平滑的。
fig, ax = plt.subplots(layout='constrained')
ax.plot(x, y)
ax.set_title('Epoch: ' + mdates.get_epoch())
ax.xaxis.set_tick_params(rotation=40)
plt.show()

_reset_epoch_for_tutorial()  # Don't do this.  Just for this tutorial.
參考資料
此範例中顯示下列函式、方法、類別和模組的用法
腳本總執行時間: (0 分鐘 2.153 秒)