注意
前往結尾以下載完整範例程式碼。
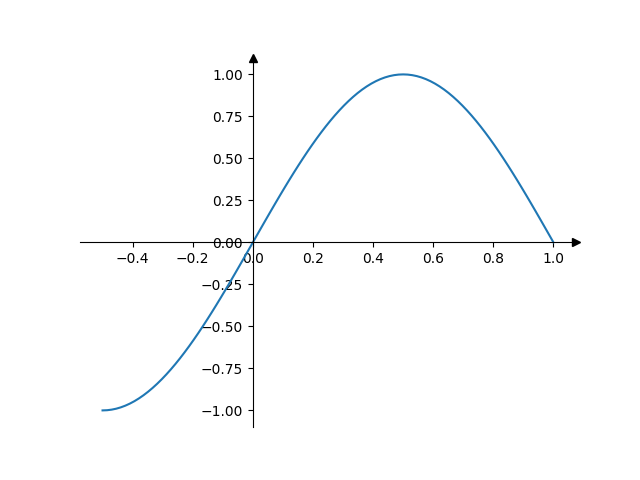
帶箭頭的居中軸脊#
此範例示範如何繪製「數學教科書」風格的繪圖,其中軸脊(「軸線」)繪製在 x = 0 和 y = 0,並且末端帶有箭頭。
import matplotlib.pyplot as plt
import numpy as np

fig, ax = plt.subplots()
# Move the left and bottom spines to x = 0 and y = 0, respectively.
ax.spines[["left", "bottom"]].set_position(("data", 0))
# Hide the top and right spines.
ax.spines[["top", "right"]].set_visible(False)

# Draw arrows (as black triangles: ">k"/"^k") at the end of the axes.  In each
# case, one of the coordinates (0) is a data coordinate (i.e., y = 0 or x = 0,
# respectively) and the other one (1) is an axes coordinate (i.e., at the very
# right/top of the axes).  Also, disable clipping (clip_on=False) as the marker
# actually spills out of the Axes.
ax.plot(1, 0, ">k", transform=ax.get_yaxis_transform(), clip_on=False)
ax.plot(0, 1, "^k", transform=ax.get_xaxis_transform(), clip_on=False)

# Some sample data.
x = np.linspace(-0.5, 1., 100)
ax.plot(x, np.sin(x*np.pi))

plt.show()