注意
前往末尾下載完整的範例程式碼。
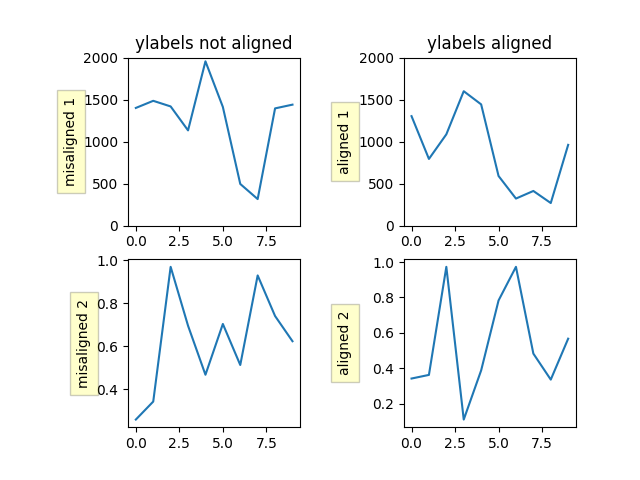
對齊 y 軸標籤#
此處顯示兩種方法,一種是快速呼叫 Figure.align_ylabels,第二種是手動對齊標籤的方法。
import matplotlib.pyplot as plt
import numpy as np


def make_plot(axs):
    box = dict(facecolor='yellow', pad=5, alpha=0.2)

    # Fixing random state for reproducibility
    np.random.seed(19680801)
    ax1 = axs[0, 0]
    ax1.plot(2000*np.random.rand(10))
    ax1.set_title('ylabels not aligned')
    ax1.set_ylabel('misaligned 1', bbox=box)
    ax1.set_ylim(0, 2000)

    ax3 = axs[1, 0]
    ax3.set_ylabel('misaligned 2', bbox=box)
    ax3.plot(np.random.rand(10))

    ax2 = axs[0, 1]
    ax2.set_title('ylabels aligned')
    ax2.plot(2000*np.random.rand(10))
    ax2.set_ylabel('aligned 1', bbox=box)
    ax2.set_ylim(0, 2000)

    ax4 = axs[1, 1]
    ax4.plot(np.random.rand(10))
    ax4.set_ylabel('aligned 2', bbox=box)


# Plot 1:
fig, axs = plt.subplots(2, 2)
fig.subplots_adjust(left=0.2, wspace=0.6)
make_plot(axs)

# just align the last column of Axes:
fig.align_ylabels(axs[:, 1])
plt.show()

另請參閱
Figure.align_ylabels 和 Figure.align_labels 可直接執行相同的操作。另請參閱 對齊標籤和標題
或者,我們可以透過使用 y 軸物件的 set_label_coords 方法,手動對齊子圖之間的軸標籤。請注意,這需要我們知道一個固定的好偏移值。
參考文獻
此範例中顯示了以下函式、方法、類別和模組的使用
腳本的總執行時間: (0 分 2.489 秒)