注意
前往結尾下載完整範例程式碼。
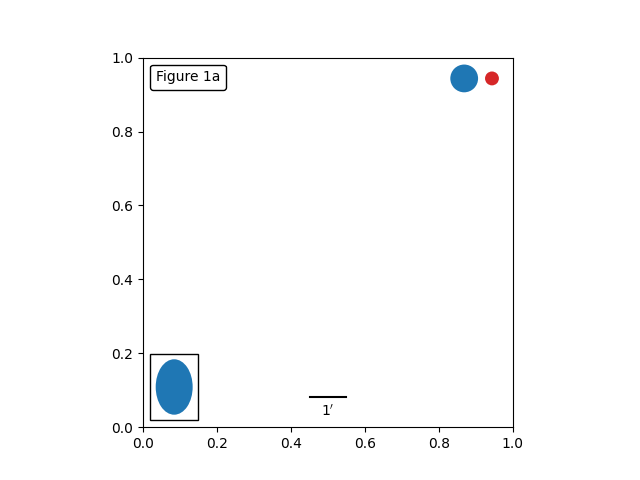
錨定圖元#
此範例說明如何使用錨定物件,而無需使用 mpl_toolkits.axes_grid1 中找到的輔助類別。此版本的圖形與 簡單錨定圖元 中的圖形相似,但它僅使用 matplotlib 命名空間實作,而無需額外的工具組協助。
from matplotlib import pyplot as plt
from matplotlib.lines import Line2D
from matplotlib.offsetbox import (AnchoredOffsetbox, AuxTransformBox,
                                  DrawingArea, TextArea, VPacker)
from matplotlib.patches import Circle, Ellipse


def draw_text(ax):
    """Draw a text-box anchored to the upper-left corner of the figure."""
    box = AnchoredOffsetbox(child=TextArea("Figure 1a"),
                            loc="upper left", frameon=True)
    box.patch.set_boxstyle("round,pad=0.,rounding_size=0.2")
    ax.add_artist(box)


def draw_circles(ax):
    """Draw circles in axes coordinates."""
    area = DrawingArea(width=40, height=20)
    area.add_artist(Circle((10, 10), 10, fc="tab:blue"))
    area.add_artist(Circle((30, 10), 5, fc="tab:red"))
    box = AnchoredOffsetbox(
        child=area, loc="upper right", pad=0, frameon=False)
    ax.add_artist(box)


def draw_ellipse(ax):
    """Draw an ellipse of width=0.1, height=0.15 in data coordinates."""
    aux_tr_box = AuxTransformBox(ax.transData)
    aux_tr_box.add_artist(Ellipse((0, 0), width=0.1, height=0.15))
    box = AnchoredOffsetbox(child=aux_tr_box, loc="lower left", frameon=True)
    ax.add_artist(box)


def draw_sizebar(ax):
    """
    Draw a horizontal bar with length of 0.1 in data coordinates,
    with a fixed label center-aligned underneath.
    """
    size = 0.1
    text = r"1$^{\prime}$"
    sizebar = AuxTransformBox(ax.transData)
    sizebar.add_artist(Line2D([0, size], [0, 0], color="black"))
    text = TextArea(text)
    packer = VPacker(
        children=[sizebar, text], align="center", sep=5)  # separation in points.
    ax.add_artist(AnchoredOffsetbox(
        child=packer, loc="lower center", frameon=False,
        pad=0.1, borderpad=0.5))  # paddings relative to the legend fontsize.


fig, ax = plt.subplots()
ax.set_aspect(1)

draw_text(ax)
draw_circles(ax)
draw_ellipse(ax)
draw_sizebar(ax)

plt.show()