注意
前往結尾以下載完整的範例程式碼。
標示子圖#
標示子圖相對簡單,並且會有所不同,因此 Matplotlib 沒有通用的方法來執行此操作。
我們展示兩種方法,以從軸的角落以指定的物理偏移量(以字體大小單位或點為單位)定位文字:一種使用 annotate,另一種使用 ScaledTranslation。
為方便起見,此範例使用 pyplot.subplot_mosaic 和子圖標籤作為子圖的鍵。但是,此方法也適用於 pyplot.subplots 或與您想要標示子圖的內容不同的鍵。
import matplotlib.pyplot as plt

from matplotlib.transforms import ScaledTranslation
fig, axs = plt.subplot_mosaic([['a)', 'c)'], ['b)', 'c)'], ['d)', 'd)']],
layout='constrained')
for label, ax in axs.items():
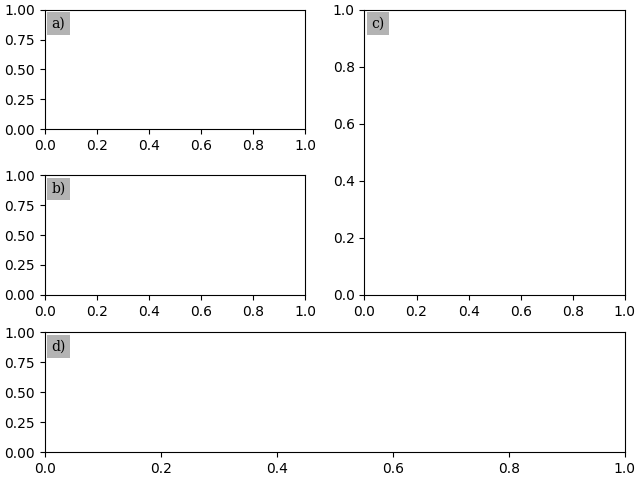
# Use Axes.annotate to put the label
# - at the top left corner (axes fraction (0, 1)),
# - offset half-a-fontsize right and half-a-fontsize down
# (offset fontsize (+0.5, -0.5)),
# i.e. just inside the axes.
ax.annotate(
label,
xy=(0, 1), xycoords='axes fraction',
xytext=(+0.5, -0.5), textcoords='offset fontsize',
fontsize='medium', verticalalignment='top', fontfamily='serif',
bbox=dict(facecolor='0.7', edgecolor='none', pad=3.0))
fig, axs = plt.subplot_mosaic([['a)', 'c)'], ['b)', 'c)'], ['d)', 'd)']],
layout='constrained')
for label, ax in axs.items():
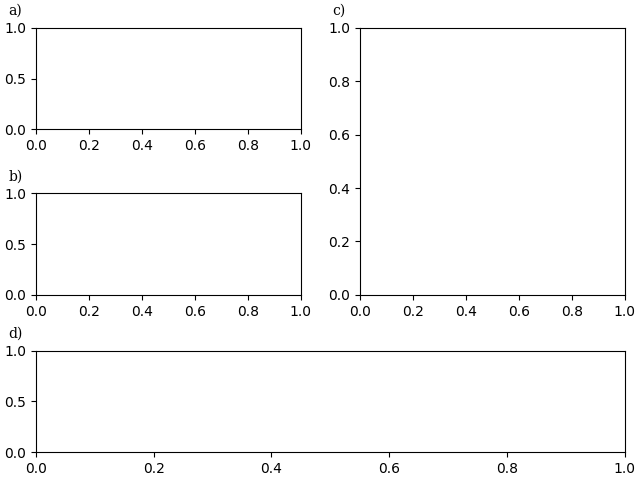
# Use ScaledTranslation to put the label
# - at the top left corner (axes fraction (0, 1)),
# - offset 20 pixels left and 7 pixels up (offset points (-20, +7)),
# i.e. just outside the axes.
ax.text(
0.0, 1.0, label, transform=(
ax.transAxes + ScaledTranslation(-20/72, +7/72, fig.dpi_scale_trans)),
fontsize='medium', va='bottom', fontfamily='serif')
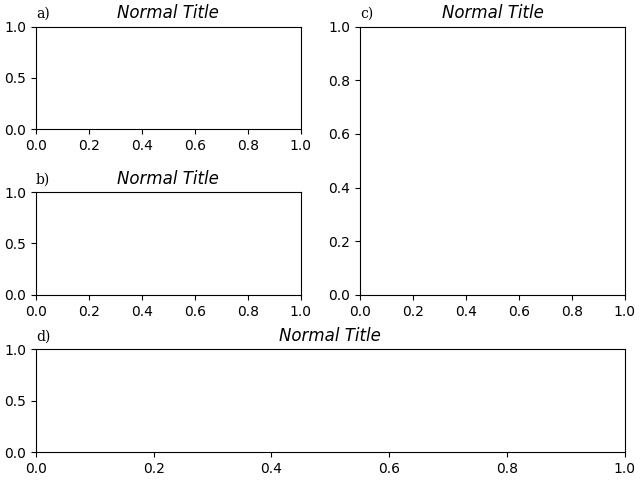
如果我們希望與標題對齊,則可以併入標題中或使用 loc 關鍵字參數
fig, axs = plt.subplot_mosaic([['a)', 'c)'], ['b)', 'c)'], ['d)', 'd)']],
                              layout='constrained')
for label, ax in axs.items():
    ax.set_title('Normal Title', fontstyle='italic')
    ax.set_title(label, fontfamily='serif', loc='left', fontsize='medium')

plt.show()
參考文獻
此範例中顯示了以下函數、方法、類別和模組的使用方式
腳本總執行時間:(0 分鐘 4.233 秒)