注意
跳至結尾以下載完整的範例程式碼。
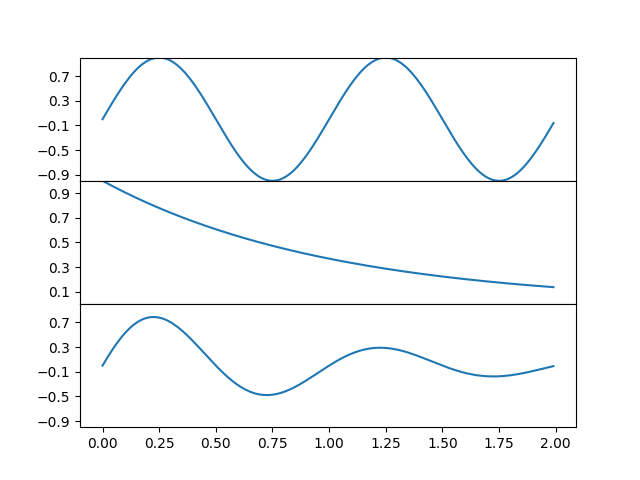
相鄰子圖#
若要建立共用通用軸 (視覺上) 的繪圖,您可以將子圖之間的 hspace 設定為零。在建立子圖時傳遞 sharex=True 將會自動關閉除底部軸以外的所有 x 刻度和標籤。
在此範例中,繪圖共用通用 x 軸,但您可以遵循相同的邏輯來供應通用 y 軸。
import matplotlib.pyplot as plt
import numpy as np

t = np.arange(0.0, 2.0, 0.01)

s1 = np.sin(2 * np.pi * t)
s2 = np.exp(-t)
s3 = s1 * s2

fig, axs = plt.subplots(3, 1, sharex=True)
# Remove vertical space between Axes
fig.subplots_adjust(hspace=0)

# Plot each graph, and manually set the y tick values
axs[0].plot(t, s1)
axs[0].set_yticks(np.arange(-0.9, 1.0, 0.4))
axs[0].set_ylim(-1, 1)

axs[1].plot(t, s2)
axs[1].set_yticks(np.arange(0.1, 1.0, 0.2))
axs[1].set_ylim(0, 1)

axs[2].plot(t, s3)
axs[2].set_yticks(np.arange(-0.9, 1.0, 0.4))
axs[2].set_ylim(-1, 1)

plt.show()