注意
前往結尾下載完整的範例程式碼。
帶標籤的圓餅圖和甜甜圈#
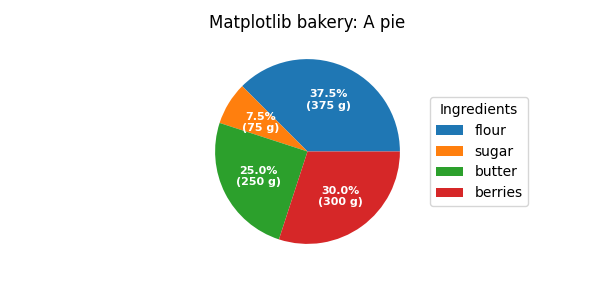
歡迎來到 Matplotlib 烘焙坊。我們將透過 pie 方法建立圓餅圖和甜甜圈圖,並示範如何使用 legend 以及 annotations 來標記它們。
如同往常,我們先定義匯入,並建立具有子圖的圖形。現在是製作圓餅圖的時候了。從圓餅圖食譜開始,我們建立資料和標籤列表。
我們可以為 autopct 引數提供一個函數,此函數會透過顯示絕對值來擴充自動百分比標記;我們從相對資料和所有值的已知總和反向計算後者。
然後,我們建立圓餅圖並儲存傳回的物件以供稍後使用。傳回元組的第一個傳回元素是楔形列表。這些是 matplotlib.patches.Wedge 修補程式,可直接用作圖例的控制代碼。我們可以使用圖例的 bbox_to_anchor 引數將圖例放置在圓餅圖外。在此,我們使用座標軸座標 (1, 0, 0.5, 1) 以及位置 "center left";即,圖例的左中心點將位於邊界方塊的左中心點,在座標軸座標中從 (1, 0) 延伸到 (1.5, 1)。
import matplotlib.pyplot as plt
import numpy as np

fig, ax = plt.subplots(figsize=(6, 3), subplot_kw=dict(aspect="equal"))

recipe = ["375 g flour",
          "75 g sugar",
          "250 g butter",
          "300 g berries"]

data = [float(x.split()[0]) for x in recipe]
ingredients = [x.split()[-1] for x in recipe]


def func(pct, allvals):
    absolute = int(np.round(pct/100.*np.sum(allvals)))
    return f"{pct:.1f}%\n({absolute:d} g)"


wedges, texts, autotexts = ax.pie(data, autopct=lambda pct: func(pct, data),
                                  textprops=dict(color="w"))

ax.legend(wedges, ingredients,
          title="Ingredients",
          loc="center left",
          bbox_to_anchor=(1, 0, 0.5, 1))

plt.setp(autotexts, size=8, weight="bold")

ax.set_title("Matplotlib bakery: A pie")

plt.show()
現在是製作甜甜圈的時候了。從甜甜圈食譜開始,我們將資料轉換為數字(將 1 個雞蛋轉換為 50 克),並直接繪製圓餅圖。圓餅圖?等等...它不是要變成甜甜圈嗎?好吧,正如我們在此看到的,甜甜圈是一個圓餅圖,楔形具有特定 width,這與其半徑不同。它非常簡單。這是透過 wedgeprops 引數完成的。
然後,我們希望透過 annotations 標記楔形。我們首先建立一些通用屬性字典,稍後可以將其作為關鍵字引數傳遞。然後,我們疊代所有楔形,並且對於每個
計算楔形中心角的角度,
從中取得圓周上該角度的點的座標,
根據點位於圓的哪一側,判斷文字的水平對齊方式,
使用取得的角度更新連線樣式,讓註解箭頭從甜甜圈向外指向,
最後,使用所有先前確定的參數建立註解。
fig, ax = plt.subplots(figsize=(6, 3), subplot_kw=dict(aspect="equal"))

recipe = ["225 g flour",
          "90 g sugar",
          "1 egg",
          "60 g butter",
          "100 ml milk",
          "1/2 package of yeast"]

data = [225, 90, 50, 60, 100, 5]

wedges, texts = ax.pie(data, wedgeprops=dict(width=0.5), startangle=-40)

bbox_props = dict(boxstyle="square,pad=0.3", fc="w", ec="k", lw=0.72)
kw = dict(arrowprops=dict(arrowstyle="-"),
          bbox=bbox_props, zorder=0, va="center")

for i, p in enumerate(wedges):
    ang = (p.theta2 - p.theta1)/2. + p.theta1
    y = np.sin(np.deg2rad(ang))
    x = np.cos(np.deg2rad(ang))
    horizontalalignment = {-1: "right", 1: "left"}[int(np.sign(x))]
    connectionstyle = f"angle,angleA=0,angleB={ang}"
    kw["arrowprops"].update({"connectionstyle": connectionstyle})
    ax.annotate(recipe[i], xy=(x, y), xytext=(1.35*np.sign(x), 1.4*y),
                horizontalalignment=horizontalalignment, **kw)

ax.set_title("Matplotlib bakery: A donut")

plt.show()
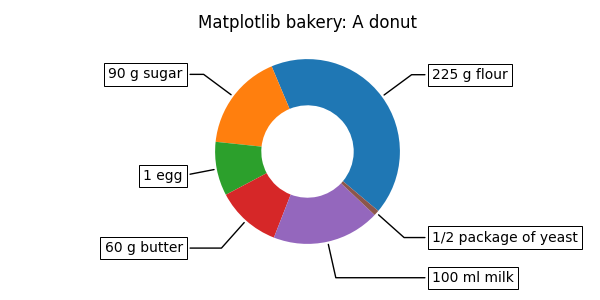
這是甜甜圈。但是請注意,如果我們要使用此食譜,這些食材足夠製作約 6 個甜甜圈 - 生產一個巨大的甜甜圈未經測試,可能會導致廚房錯誤。
參考
此範例中顯示下列函數、方法、類別和模組的使用方式