注意
前往結尾下載完整範例程式碼。
使用 plt.subplots 建立多個子圖#
pyplot.subplots 會建立一個圖形和一個子圖網格,只需單次呼叫,同時提供對個別繪圖建立方式的合理控制。對於更進階的使用案例,您可以使用 GridSpec 來獲得更一般的子圖佈局,或者使用 Figure.add_subplot 在圖形內的任意位置新增子圖。
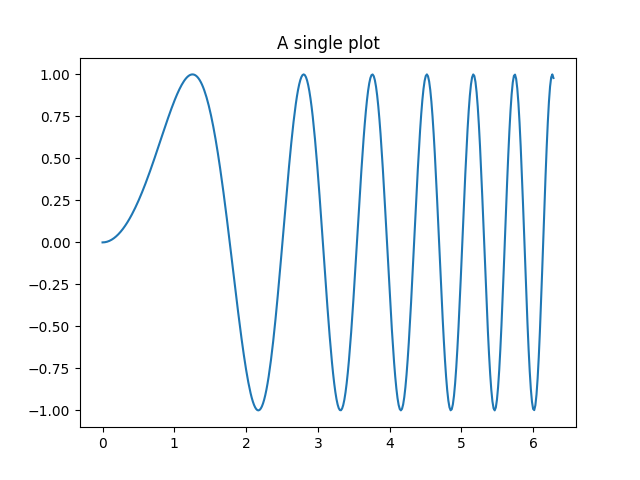
只有一個子圖的圖形#
不帶引數的 subplots() 會傳回一個 Figure 和一個單一 Axes。
這實際上是建立單一圖形和軸的最簡單且建議的方法。
fig, ax = plt.subplots()
ax.plot(x, y)
ax.set_title('A single plot')
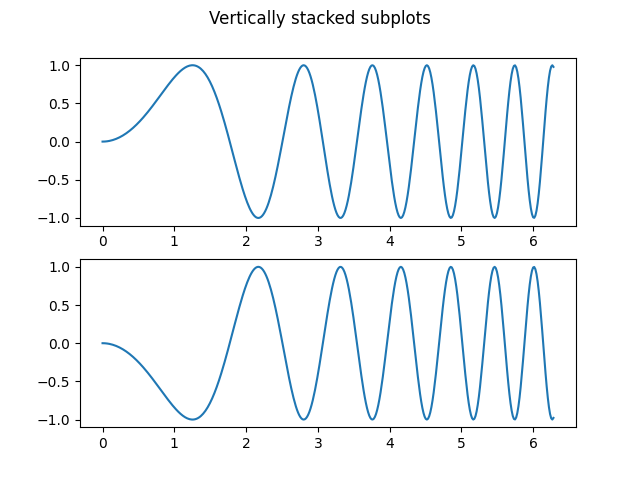
在一個方向上堆疊子圖#
pyplot.subplots 的前兩個選用引數會定義子圖網格的列數和欄數。
當只在一個方向堆疊時,傳回的 axs 是一個 1D numpy 陣列,其中包含建立的軸的清單。
fig, axs = plt.subplots(2)
fig.suptitle('Vertically stacked subplots')
axs[0].plot(x, y)
axs[1].plot(x, -y)
如果您只建立幾個軸,最好將它們立即解壓縮到每個軸的專用變數。這樣,我們可以使用 ax1 而不是更冗長的 axs[0]。
fig, (ax1, ax2) = plt.subplots(2)
fig.suptitle('Vertically stacked subplots')
ax1.plot(x, y)
ax2.plot(x, -y)

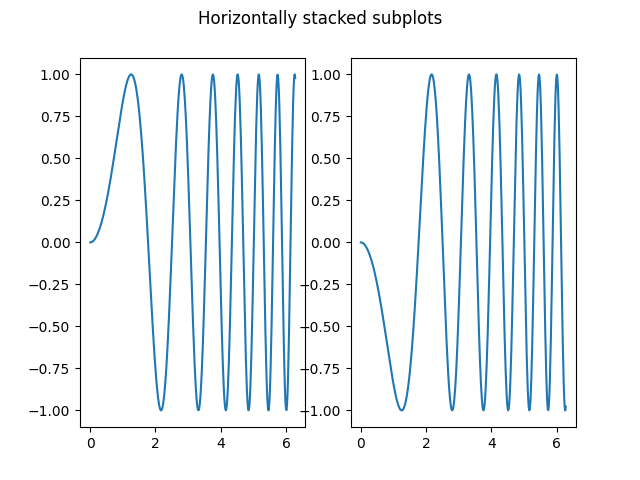
若要取得並排的子圖,請傳遞參數 1, 2 作為一列和兩欄。
fig, (ax1, ax2) = plt.subplots(1, 2)
fig.suptitle('Horizontally stacked subplots')
ax1.plot(x, y)
ax2.plot(x, -y)
在兩個方向上堆疊子圖#
當在兩個方向堆疊時,傳回的 axs 是一個 2D NumPy 陣列。
如果您必須為每個子圖設定參數,最好使用 for ax in axs.flat: 迴圈執行 2D 網格中的所有子圖。
fig, axs = plt.subplots(2, 2)
axs[0, 0].plot(x, y)
axs[0, 0].set_title('Axis [0, 0]')
axs[0, 1].plot(x, y, 'tab:orange')
axs[0, 1].set_title('Axis [0, 1]')
axs[1, 0].plot(x, -y, 'tab:green')
axs[1, 0].set_title('Axis [1, 0]')
axs[1, 1].plot(x, -y, 'tab:red')
axs[1, 1].set_title('Axis [1, 1]')

for ax in axs.flat:
    ax.set(xlabel='x-label', ylabel='y-label')

# Hide x labels and tick labels for top plots and y ticks for right plots.
for ax in axs.flat:
    ax.label_outer()
![Axis [0, 0], Axis [0, 1], Axis [1, 0], Axis [1, 1]](../../_images/sphx_glr_subplots_demo_005.png)
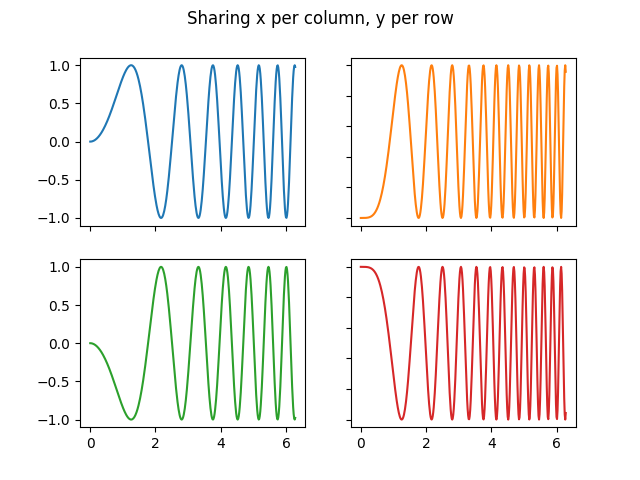
您也可以在 2D 中使用元組解包來將所有子圖指派給專用變數
fig, ((ax1, ax2), (ax3, ax4)) = plt.subplots(2, 2)
fig.suptitle('Sharing x per column, y per row')
ax1.plot(x, y)
ax2.plot(x, y**2, 'tab:orange')
ax3.plot(x, -y, 'tab:green')
ax4.plot(x, -y**2, 'tab:red')

for ax in fig.get_axes():
    ax.label_outer()
共用軸#
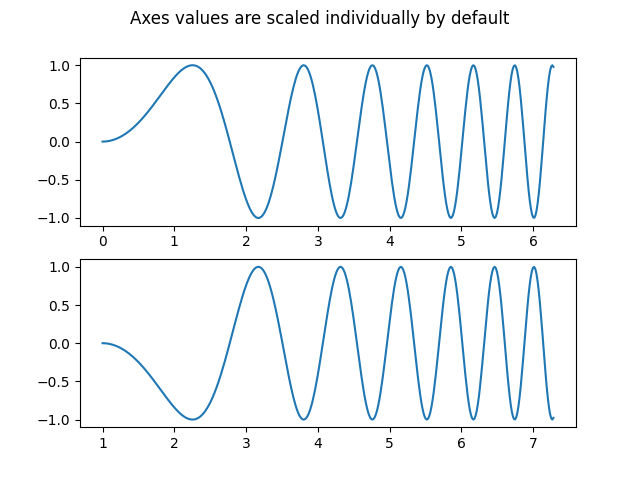
根據預設,每個軸都是個別縮放。因此,如果範圍不同,則子圖的刻度值不會對齊。
fig, (ax1, ax2) = plt.subplots(2)
fig.suptitle('Axes values are scaled individually by default')
ax1.plot(x, y)
ax2.plot(x + 1, -y)
您可以使用 sharex 或 sharey 來對齊水平或垂直軸。
fig, (ax1, ax2) = plt.subplots(2, sharex=True)
fig.suptitle('Aligning x-axis using sharex')
ax1.plot(x, y)
ax2.plot(x + 1, -y)
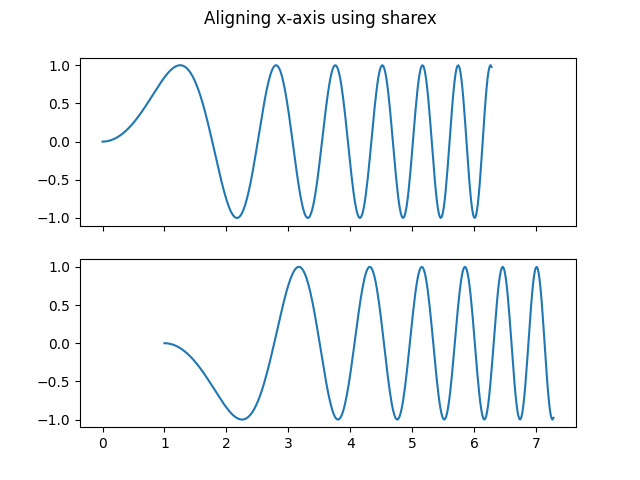
將 sharex 或 sharey 設定為 True 會啟用整個網格的整體共用,也就是說,當使用 sharey=True 時,垂直堆疊子圖的 y 軸也具有相同的刻度。
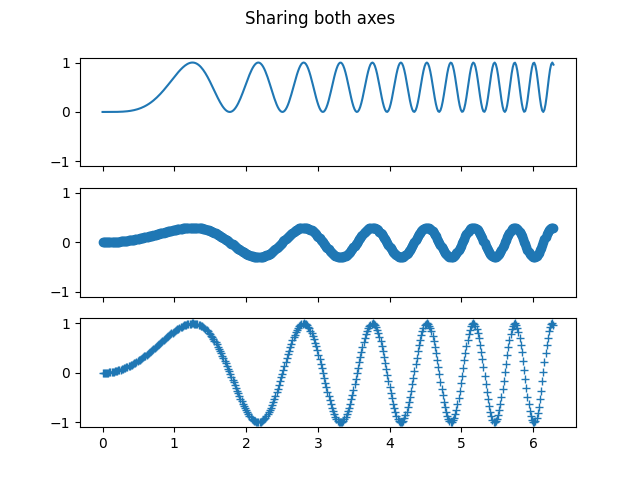
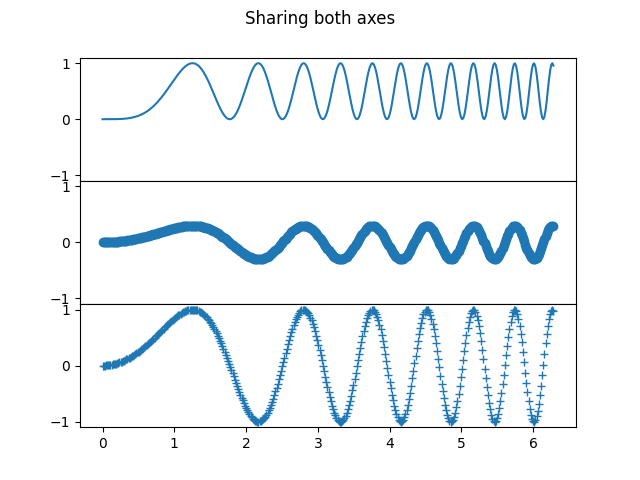
對於共用軸的子圖,一組刻度標籤就足夠了。內部軸的刻度標籤會由 sharex 和 sharey 自動移除。子圖之間仍然存在未使用的空白空間。
為了精確控制子圖的位置,可以明確地使用 GridSpec,並透過 Figure.add_gridspec 建立,然後呼叫其 subplots 方法。例如,我們可以使用 add_gridspec(hspace=0) 來減少垂直子圖之間的高度。
label_outer 是一個方便的方法,可以從不在網格邊緣的子圖中移除標籤和刻度。
fig = plt.figure()
gs = fig.add_gridspec(3, hspace=0)
axs = gs.subplots(sharex=True, sharey=True)
fig.suptitle('Sharing both axes')
axs[0].plot(x, y ** 2)
axs[1].plot(x, 0.3 * y, 'o')
axs[2].plot(x, y, '+')

# Hide x labels and tick labels for all but bottom plot.
for ax in axs:
    ax.label_outer()
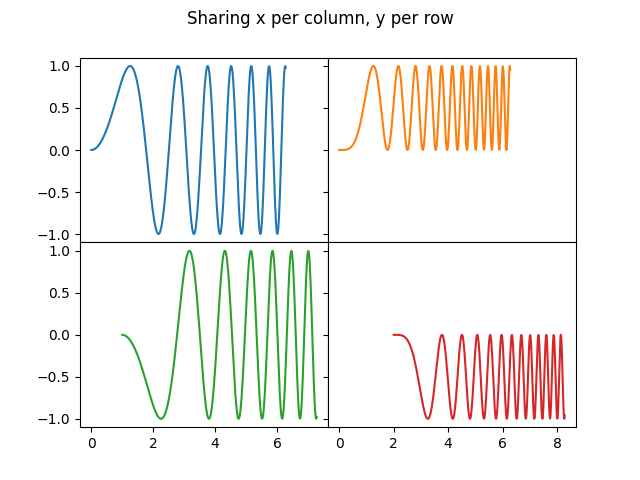
除了 True 和 False 之外,sharex 和 sharey 都接受 'row' 和 'col' 的值,以僅在每行或每列中共享值。
fig = plt.figure()
gs = fig.add_gridspec(2, 2, hspace=0, wspace=0)
(ax1, ax2), (ax3, ax4) = gs.subplots(sharex='col', sharey='row')
fig.suptitle('Sharing x per column, y per row')
ax1.plot(x, y)
ax2.plot(x, y**2, 'tab:orange')
ax3.plot(x + 1, -y, 'tab:green')
ax4.plot(x + 2, -y**2, 'tab:red')

for ax in fig.get_axes():
    ax.label_outer()
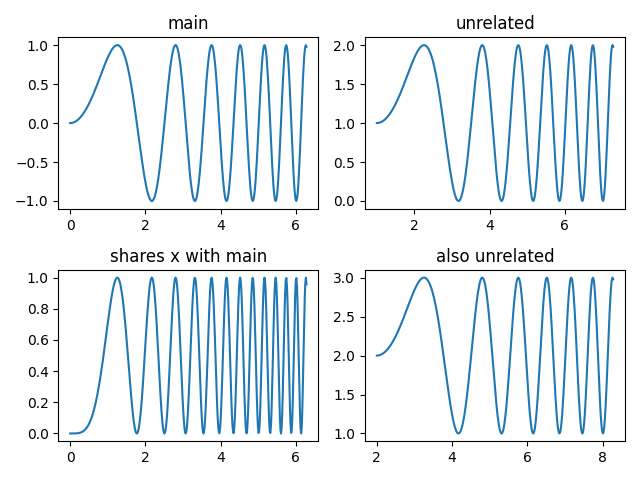
如果您想要更複雜的共享結構,您可以先創建沒有共享的 Axes 網格,然後呼叫 axes.Axes.sharex 或 axes.Axes.sharey 來後續添加共享資訊。
fig, axs = plt.subplots(2, 2)
axs[0, 0].plot(x, y)
axs[0, 0].set_title("main")
axs[1, 0].plot(x, y**2)
axs[1, 0].set_title("shares x with main")
axs[1, 0].sharex(axs[0, 0])
axs[0, 1].plot(x + 1, y + 1)
axs[0, 1].set_title("unrelated")
axs[1, 1].plot(x + 2, y + 2)
axs[1, 1].set_title("also unrelated")
fig.tight_layout()
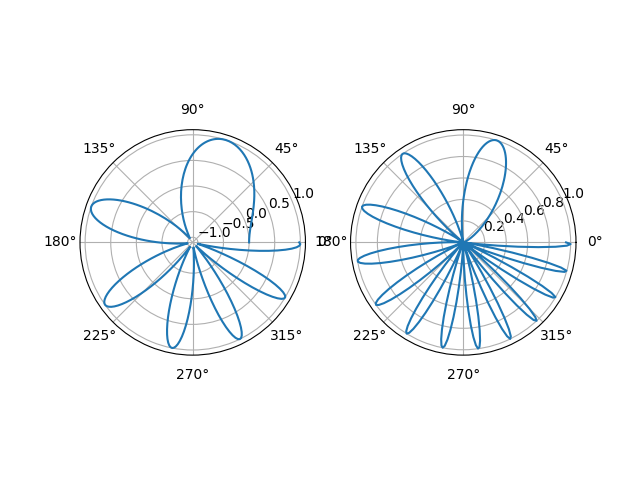
極座標軸#
pyplot.subplots 的參數 subplot_kw 控制子圖的屬性(另請參閱 Figure.add_subplot)。特別是,這可以用於創建極座標軸的網格。
腳本總執行時間:(0 分鐘 8.717 秒)