注意
前往結尾下載完整範例程式碼。
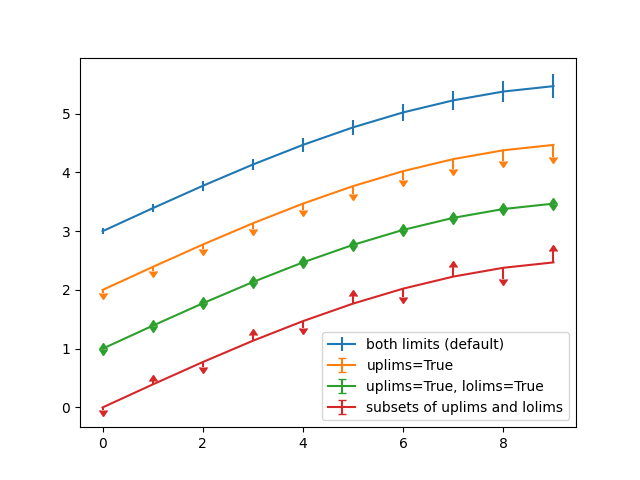
誤差條限制選取#
使用 errorbar 的參數 uplims、lolims,選擇性地在誤差條上繪製下限和/或上限符號的說明。
或者,您可以使用 2xN 值僅在一個方向上繪製誤差條。
import matplotlib.pyplot as plt
import numpy as np

fig = plt.figure()
x = np.arange(10)
y = 2.5 * np.sin(x / 20 * np.pi)
yerr = np.linspace(0.05, 0.2, 10)

plt.errorbar(x, y + 3, yerr=yerr, label='both limits (default)')

plt.errorbar(x, y + 2, yerr=yerr, uplims=True, label='uplims=True')

plt.errorbar(x, y + 1, yerr=yerr, uplims=True, lolims=True,
             label='uplims=True, lolims=True')

upperlimits = [True, False] * 5
lowerlimits = [False, True] * 5
plt.errorbar(x, y, yerr=yerr, uplims=upperlimits, lolims=lowerlimits,
             label='subsets of uplims and lolims')

plt.legend(loc='lower right')
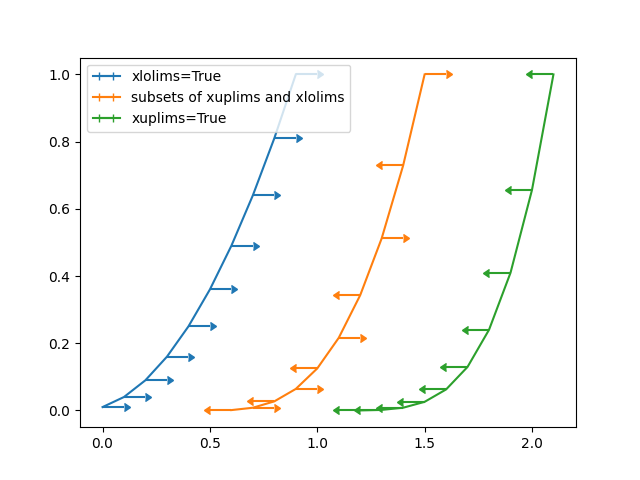
同樣,xuplims 和 xlolims 可用於水平 xerr 誤差條。
fig = plt.figure()
x = np.arange(10) / 10
y = (x + 0.1)**2

plt.errorbar(x, y, xerr=0.1, xlolims=True, label='xlolims=True')
y = (x + 0.1)**3

plt.errorbar(x + 0.6, y, xerr=0.1, xuplims=upperlimits, xlolims=lowerlimits,
             label='subsets of xuplims and xlolims')

y = (x + 0.1)**4
plt.errorbar(x + 1.2, y, xerr=0.1, xuplims=True, label='xuplims=True')

plt.legend()
plt.show()
腳本總執行時間: (0 分鐘 2.083 秒)