注意
前往結尾以下載完整的範例程式碼。
選取事件示範#
您可以藉由設定繪圖物件的「picker」屬性(例如,Matplotlib Line2D、Text、Patch、Polygon、AxesImage 等)來啟用選取功能。
picker 屬性有各種含義
None - 停用此繪圖物件的選取功能(預設)
bool - 若為 True,則會啟用選取功能,且如果滑鼠事件位於繪圖物件上方,則繪圖物件會觸發選取事件。
設定
pickradius會加入點中的 epsilon 容差,且如果繪圖物件的資料在滑鼠事件的 epsilon 範圍內,則繪圖物件會觸發事件。對於線條和修補集合等部分繪圖物件,繪圖物件可能會將其他資料提供給產生的選取事件,例如,在選取事件 epsilon 範圍內的資料索引。function - 如果 picker 可呼叫,則它是使用者提供的函式,可決定繪圖物件是否受到滑鼠事件的影響。
hit, props = picker(artist, mouseevent)
以判斷點擊測試。如果滑鼠事件位於繪圖物件上方,則傳回 hit=True,且 props 是您想要加入 PickEvent 屬性的屬性字典。
在您藉由設定「picker」屬性啟用繪圖物件的選取功能後,您需要連線至圖表畫布 pick_event,才能在滑鼠按下事件時取得選取回呼。例如:
def pick_handler(event):
    mouseevent = event.mouseevent
    artist = event.artist
    # now do something with this...
傳遞至回呼的選取事件 (matplotlib.backend_bases.PickEvent) 一律會觸發兩個屬性
- mouseevent
產生選取事件的滑鼠事件。
滑鼠事件本身具有 x 和 y(顯示空間中的座標,例如,與左側、底部的像素距離)和 xdata、ydata(資料空間中的座標)等屬性。此外,您可以取得關於已按下哪些按鈕、已按下哪些按鍵、滑鼠位於哪個軸上方等資訊。請參閱 matplotlib.backend_bases.MouseEvent 以取得詳細資訊。
- artist
產生選取事件的 matplotlib.artist。
此外,Line2D 和 PatchCollection 等特定繪圖物件可能會附加其他中繼資料,例如,符合選取器條件的資料索引(例如,線條中在指定 epsilon 容差範圍內的所有點)。
以下範例說明這些方法。
注意
這些範例會練習 Matplotlib 的互動功能,且此功能不會顯示在靜態文件中。請在您的電腦上執行此程式碼,以查看互動性。
您可以複製和貼上個別部分,或是使用頁面底部的連結下載整個範例。
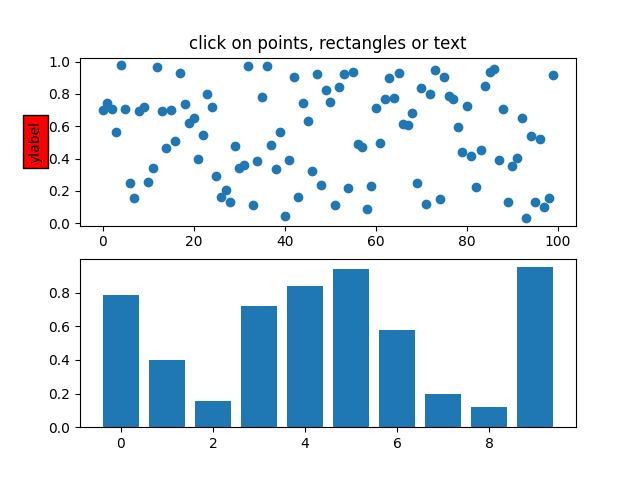
簡單的選取、線條、矩形和文字#
fig, (ax1, ax2) = plt.subplots(2, 1)
ax1.set_title('click on points, rectangles or text', picker=True)
ax1.set_ylabel('ylabel', picker=True, bbox=dict(facecolor='red'))
line, = ax1.plot(rand(100), 'o', picker=True, pickradius=5)

# Pick the rectangle.
ax2.bar(range(10), rand(10), picker=True)
for label in ax2.get_xticklabels():  # Make the xtick labels pickable.
    label.set_picker(True)


def onpick1(event):
    if isinstance(event.artist, Line2D):
        thisline = event.artist
        xdata = thisline.get_xdata()
        ydata = thisline.get_ydata()
        ind = event.ind
        print('onpick1 line:', np.column_stack([xdata[ind], ydata[ind]]))
    elif isinstance(event.artist, Rectangle):
        patch = event.artist
        print('onpick1 patch:', patch.get_path())
    elif isinstance(event.artist, Text):
        text = event.artist
        print('onpick1 text:', text.get_text())


fig.canvas.mpl_connect('pick_event', onpick1)
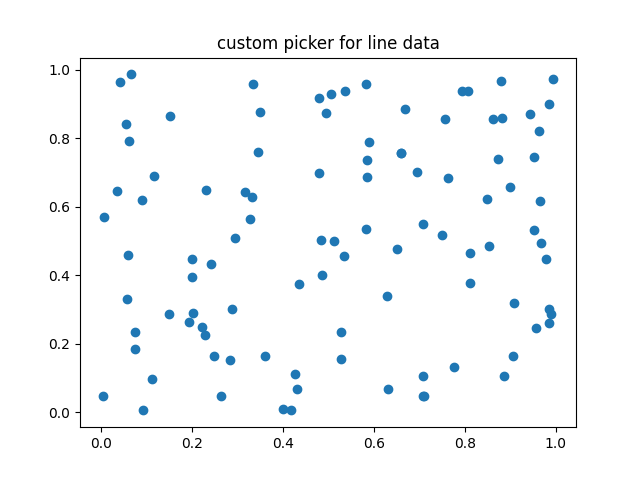
使用自訂點擊測試函式進行選取#
您可以藉由將 picker 設定為可呼叫的函式,來定義自訂選取器。函式的簽章為
hit, props = func(artist, mouseevent)
以判斷點擊測試。如果滑鼠事件位於繪圖物件上方,則傳回 hit=True,且 props 是您想要加入 PickEvent 屬性的屬性字典。
def line_picker(line, mouseevent):
    """
    Find the points within a certain distance from the mouseclick in
    data coords and attach some extra attributes, pickx and picky
    which are the data points that were picked.
    """
    if mouseevent.xdata is None:
        return False, dict()
    xdata = line.get_xdata()
    ydata = line.get_ydata()
    maxd = 0.05
    d = np.sqrt(
        (xdata - mouseevent.xdata)**2 + (ydata - mouseevent.ydata)**2)

    ind, = np.nonzero(d <= maxd)
    if len(ind):
        pickx = xdata[ind]
        picky = ydata[ind]
        props = dict(ind=ind, pickx=pickx, picky=picky)
        return True, props
    else:
        return False, dict()


def onpick2(event):
    print('onpick2 line:', event.pickx, event.picky)


fig, ax = plt.subplots()
ax.set_title('custom picker for line data')
line, = ax.plot(rand(100), rand(100), 'o', picker=line_picker)
fig.canvas.mpl_connect('pick_event', onpick2)
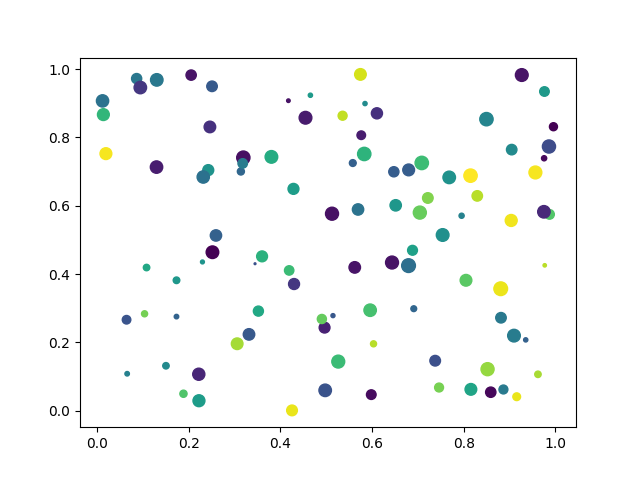
在散佈圖上選取#
散佈圖由 PathCollection 支援。
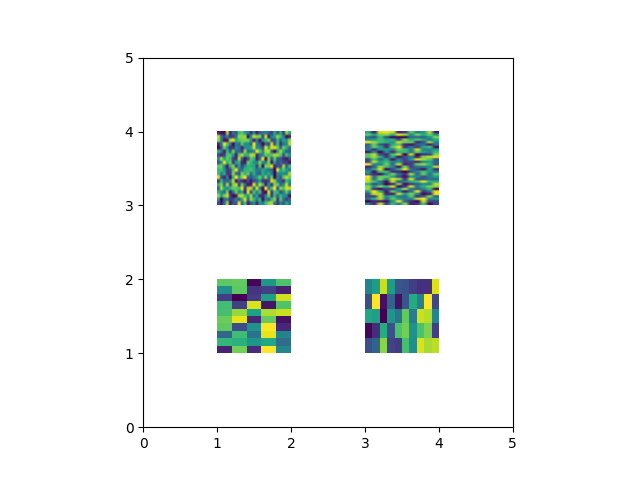
選取影像#
使用 Axes.imshow 繪製的影像會是 AxesImage 物件。
fig, ax = plt.subplots()
ax.imshow(rand(10, 5), extent=(1, 2, 1, 2), picker=True)
ax.imshow(rand(5, 10), extent=(3, 4, 1, 2), picker=True)
ax.imshow(rand(20, 25), extent=(1, 2, 3, 4), picker=True)
ax.imshow(rand(30, 12), extent=(3, 4, 3, 4), picker=True)
ax.set(xlim=(0, 5), ylim=(0, 5))


def onpick4(event):
    artist = event.artist
    if isinstance(artist, AxesImage):
        im = artist
        A = im.get_array()
        print('onpick4 image', A.shape)


fig.canvas.mpl_connect('pick_event', onpick4)

plt.show()
腳本總執行時間: (0 分鐘 2.043 秒)