注意
前往末尾 以下載完整的範例程式碼。
使用邊界和 sticky_edges 控制視圖範圍#
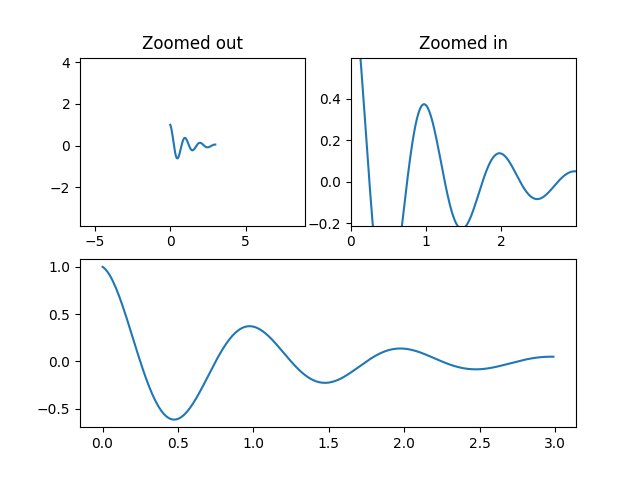
本範例中的第一個圖形顯示如何使用 margins 而不是 set_xlim 和 set_ylim 來放大和縮小繪圖。第二個圖形示範了某些方法和藝術家所引入的邊緣「黏性」概念,以及如何有效地解決這個問題。
import matplotlib.pyplot as plt
import numpy as np

from matplotlib.patches import Polygon


def f(t):
    return np.exp(-t) * np.cos(2*np.pi*t)


t1 = np.arange(0.0, 3.0, 0.01)

ax1 = plt.subplot(212)
ax1.margins(0.05)           # Default margin is 0.05, value 0 means fit
ax1.plot(t1, f(t1))

ax2 = plt.subplot(221)
ax2.margins(2, 2)           # Values >0.0 zoom out
ax2.plot(t1, f(t1))
ax2.set_title('Zoomed out')

ax3 = plt.subplot(222)
ax3.margins(x=0, y=-0.25)   # Values in (-0.5, 0.0) zooms in to center
ax3.plot(t1, f(t1))
ax3.set_title('Zoomed in')

plt.show()
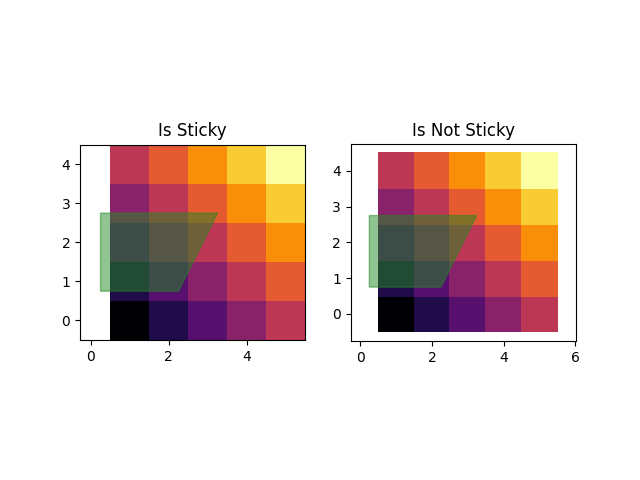
關於某些繪圖方法的「黏性」#
某些繪圖函式會使軸範圍「黏性」或不受 margins 方法的影響。例如,imshow 和 pcolor 希望使用者想要將範圍緊密地圍繞著繪圖中顯示的像素。如果不需要這種行為,您需要將 use_sticky_edges 設定為 False。考慮以下範例
y, x = np.mgrid[:5, 1:6]
poly_coords = [
    (0.25, 2.75), (3.25, 2.75),
    (2.25, 0.75), (0.25, 0.75)
]
fig, (ax1, ax2) = plt.subplots(ncols=2)

# Here we set the stickiness of the Axes object...
# ax1 we'll leave as the default, which uses sticky edges
# and we'll turn off stickiness for ax2
ax2.use_sticky_edges = False

for ax, status in zip((ax1, ax2), ('Is', 'Is Not')):
    cells = ax.pcolor(x, y, x+y, cmap='inferno', shading='auto')  # sticky
    ax.add_patch(
        Polygon(poly_coords, color='forestgreen', alpha=0.5)
    )  # not sticky
    ax.margins(x=0.1, y=0.05)
    ax.set_aspect('equal')
    ax.set_title(f'{status} Sticky')

plt.show()
參考資料
本範例中顯示了以下函式、方法、類別和模組的用法
腳本總執行時間:(0 分鐘 1.830 秒)