注意
前往結尾以下載完整的範例程式碼。
使用 subplots 和 GridSpec 組合兩個子圖#
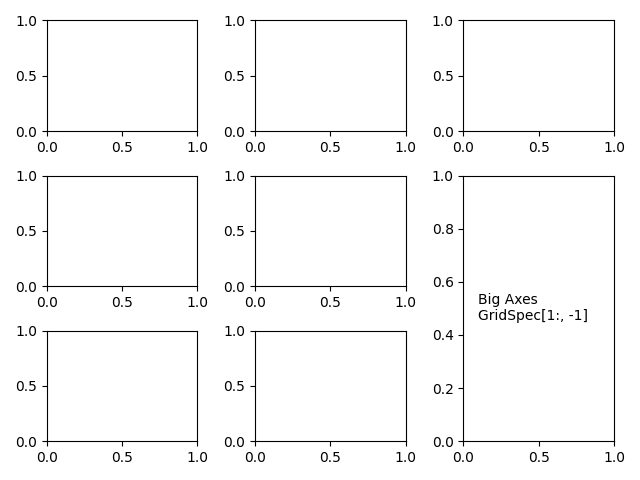
有時我們想要將使用 subplots 建立的軸版面配置中的兩個子圖組合。我們可以從軸取得 GridSpec,然後移除覆蓋的軸,並用新的較大軸填補空隙。在這裡,我們建立一個版面配置,其中最後一欄的底部兩個軸組合在一起。
若要從這個版面配置開始(而不是移除重疊的軸),請使用 subplot_mosaic。
另請參閱 在圖表中排列多個軸。
import matplotlib.pyplot as plt

fig, axs = plt.subplots(ncols=3, nrows=3)
gs = axs[1, 2].get_gridspec()
# remove the underlying Axes
for ax in axs[1:, -1]:
    ax.remove()
axbig = fig.add_subplot(gs[1:, -1])
axbig.annotate('Big Axes \nGridSpec[1:, -1]', (0.1, 0.5),
               xycoords='axes fraction', va='center')

fig.tight_layout()

plt.show()
腳本的總執行時間: (0 分鐘 1.714 秒)