注意
前往結尾下載完整的範例程式碼。
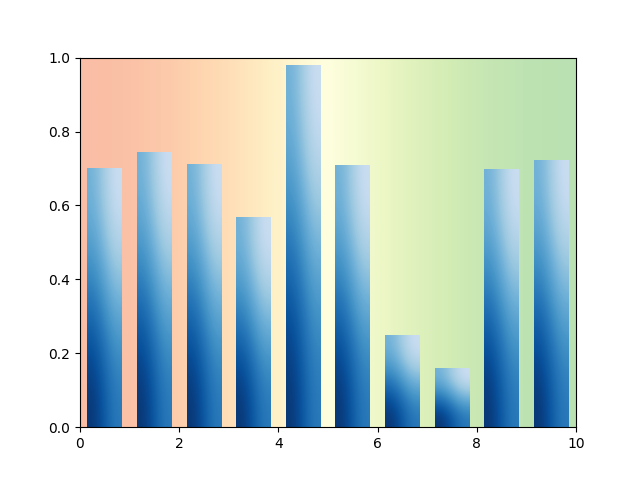
具有漸層的長條圖#
Matplotlib 原生不支援漸層。但是,我們可以透過大小和色彩正確的 AxesImage 來模擬填滿漸層的矩形。
特別是,我們使用色彩圖來產生實際的色彩。然後只需定義影像角落的基礎值,並讓雙三次內插法填滿區域。我們使用單位向量 *v* 來定義漸層方向。然後,透過角落向量在 *v* 上的投影長度來取得角落的值。
類似的方法可用於建立軸的漸層背景。在這種情況下,使用軸座標 (extent=(0, 1, 0, 1), transform=ax.transAxes) 會很有幫助,使其與資料座標無關。
import matplotlib.pyplot as plt
import numpy as np

np.random.seed(19680801)


def gradient_image(ax, direction=0.3, cmap_range=(0, 1), **kwargs):
    """
    Draw a gradient image based on a colormap.

    Parameters
    ----------
    ax : Axes
        The Axes to draw on.
    direction : float
        The direction of the gradient. This is a number in
        range 0 (=vertical) to 1 (=horizontal).
    cmap_range : float, float
        The fraction (cmin, cmax) of the colormap that should be
        used for the gradient, where the complete colormap is (0, 1).
    **kwargs
        Other parameters are passed on to `.Axes.imshow()`.
        In particular, *cmap*, *extent*, and *transform* may be useful.
    """
    phi = direction * np.pi / 2
    v = np.array([np.cos(phi), np.sin(phi)])
    X = np.array([[v @ [1, 0], v @ [1, 1]],
                  [v @ [0, 0], v @ [0, 1]]])
    a, b = cmap_range
    X = a + (b - a) / X.max() * X
    im = ax.imshow(X, interpolation='bicubic', clim=(0, 1),
                   aspect='auto', **kwargs)
    return im


def gradient_bar(ax, x, y, width=0.5, bottom=0):
    for left, top in zip(x, y):
        right = left + width
        gradient_image(ax, extent=(left, right, bottom, top),
                       cmap=plt.cm.Blues_r, cmap_range=(0, 0.8))


fig, ax = plt.subplots()
ax.set(xlim=(0, 10), ylim=(0, 1))

# background image
gradient_image(ax, direction=1, extent=(0, 1, 0, 1), transform=ax.transAxes,
               cmap=plt.cm.RdYlGn, cmap_range=(0.2, 0.8), alpha=0.5)

N = 10
x = np.arange(N) + 0.15
y = np.random.rand(N)
gradient_bar(ax, x, y, width=0.7)
plt.show()
腳本總執行時間:(0 分鐘 1.395 秒)