注意
前往結尾下載完整範例程式碼。
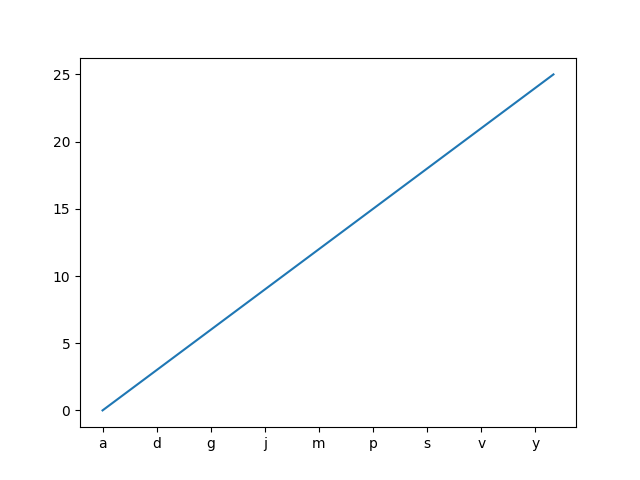
從值列表設定刻度標籤#
使用 Axes.set_xticks 會導致刻度標籤設定在目前選擇的刻度上。但是,您可能希望允許 matplotlib 動態選擇刻度的數量及其間距。
在這種情況下,最好從刻度值決定刻度標籤。以下範例顯示如何執行此操作。
注意:此處使用 ticker.MaxNLocator,以確保刻度值採用整數值。
import matplotlib.pyplot as plt

from matplotlib.ticker import MaxNLocator

fig, ax = plt.subplots()
xs = range(26)
ys = range(26)
labels = list('abcdefghijklmnopqrstuvwxyz')


def format_fn(tick_val, tick_pos):
    if int(tick_val) in xs:
        return labels[int(tick_val)]
    else:
        return ''


# A FuncFormatter is created automatically.
ax.xaxis.set_major_formatter(format_fn)
ax.xaxis.set_major_locator(MaxNLocator(integer=True))
ax.plot(xs, ys)
plt.show()
參考文獻
此範例中顯示以下函數、方法、類別和模組的用法