注意
前往結尾 以下載完整的範例程式碼。
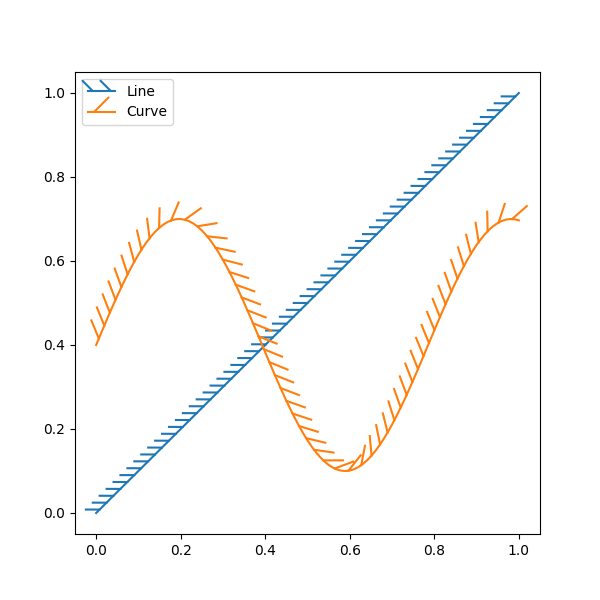
具有刻度路徑效果的線#
可以使用 TickedStroke 沿著線新增刻度,將一側標記為障礙。您可以控制刻度的角度、間距和長度。
刻度也會適當地顯示在圖例中。
import matplotlib.pyplot as plt
import numpy as np

from matplotlib import patheffects

# Plot a straight diagonal line with ticked style path
fig, ax = plt.subplots(figsize=(6, 6))
ax.plot([0, 1], [0, 1], label="Line",
        path_effects=[patheffects.withTickedStroke(spacing=7, angle=135)])

# Plot a curved line with ticked style path
nx = 101
x = np.linspace(0.0, 1.0, nx)
y = 0.3*np.sin(x*8) + 0.4
ax.plot(x, y, label="Curve", path_effects=[patheffects.withTickedStroke()])

ax.legend()

plt.show()