注意
移至結尾 以下載完整範例程式碼。
多重游標#
在多個圖表上同時顯示游標。
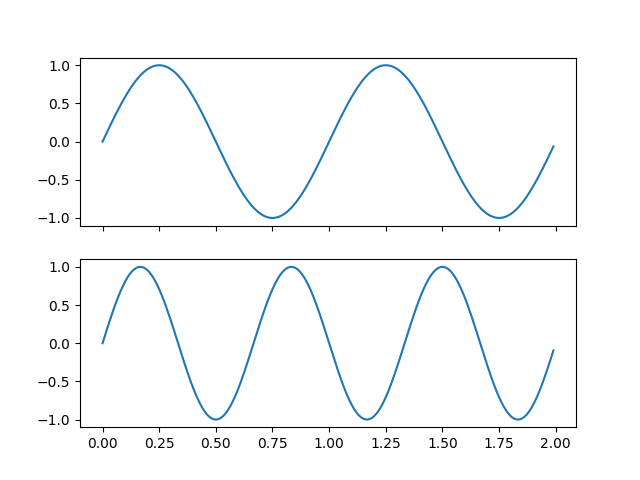
此範例會產生三個軸,這些軸會分割在兩個不同的圖形上。當游標懸停在一個子圖中的資料上方時,該資料點的值會顯示在所有軸中。
import matplotlib.pyplot as plt
import numpy as np
from matplotlib.widgets import MultiCursor
t = np.arange(0.0, 2.0, 0.01)
s1 = np.sin(2*np.pi*t)
s2 = np.sin(3*np.pi*t)
s3 = np.sin(4*np.pi*t)
fig, (ax1, ax2) = plt.subplots(2, sharex=True)
ax1.plot(t, s1)
ax2.plot(t, s2)
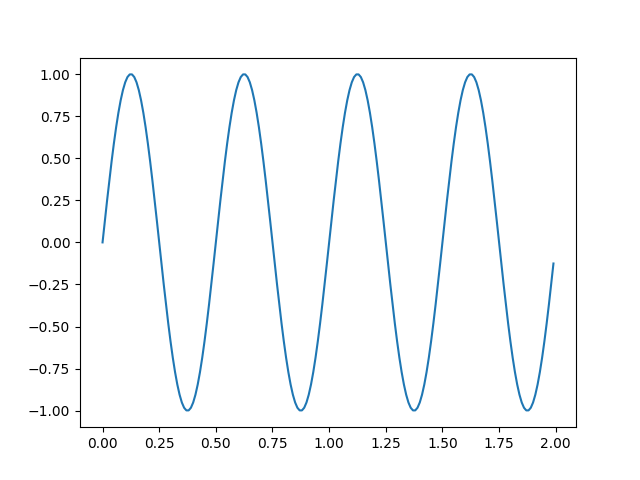
fig, ax3 = plt.subplots()
ax3.plot(t, s3)
multi = MultiCursor(None, (ax1, ax2, ax3), color='r', lw=1)
plt.show()
腳本的總執行時間: (0 分鐘 1.497 秒)