注意
前往結尾以下載完整範例程式碼。
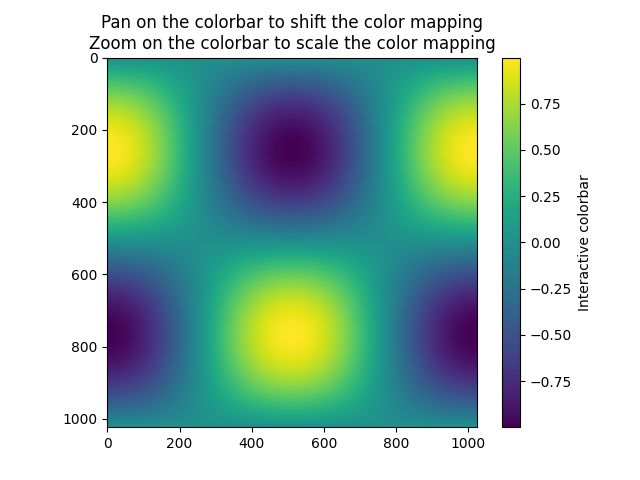
互動式調整色彩對應範圍#
示範如何使用色彩條來互動式調整影像色彩對應的範圍。若要使用互動功能,您必須處於縮放模式(放大鏡工具列按鈕)或平移模式(四向箭頭工具列按鈕)中,並在色彩條內按一下。
縮放時,縮放區域的邊界方塊會定義標準的新 vmin 和 vmax。使用滑鼠右鍵縮放會按比例擴展 vmin 和 vmax 到選取區域,如同在軸上縮小一樣。平移時,標準的 vmin 和 vmax 都會根據移動方向移動。也可以使用 Home/Back/Forward 按鈕回到之前的狀態。
import matplotlib.pyplot as plt
import numpy as np

t = np.linspace(0, 2 * np.pi, 1024)
data2d = np.sin(t)[:, np.newaxis] * np.cos(t)[np.newaxis, :]

fig, ax = plt.subplots()
im = ax.imshow(data2d)
ax.set_title('Pan on the colorbar to shift the color mapping\n'
             'Zoom on the colorbar to scale the color mapping')

fig.colorbar(im, ax=ax, label='Interactive colorbar')

plt.show()
指令碼的總執行時間:(0 分鐘 2.382 秒)