注意
前往末尾以下載完整範例程式碼。
等高線標籤範例#
說明可以使用等高線標籤執行的一些更進階的操作。
另請參閱等高線範例。
import matplotlib.pyplot as plt
import numpy as np

import matplotlib.ticker as ticker
定義我們的曲面
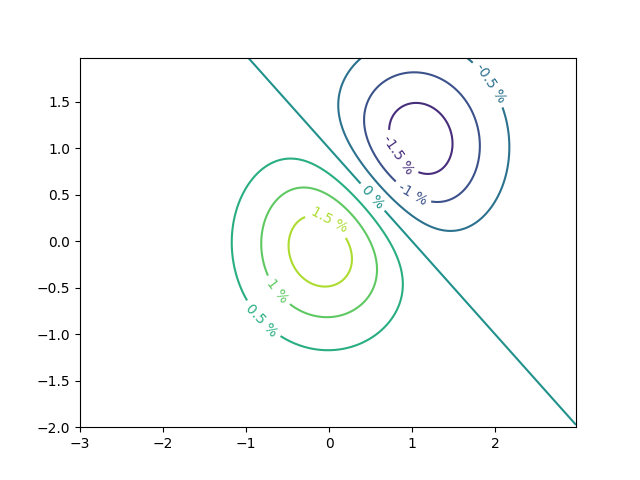
使用自訂水平格式器製作等高線標籤
# This custom formatter removes trailing zeros, e.g. "1.0" becomes "1", and
# then adds a percent sign.
def fmt(x):
    s = f"{x:.1f}"
    if s.endswith("0"):
        s = f"{x:.0f}"
    return rf"{s} \%" if plt.rcParams["text.usetex"] else f"{s} %"


# Basic contour plot
fig, ax = plt.subplots()
CS = ax.contour(X, Y, Z)

ax.clabel(CS, CS.levels, fmt=fmt, fontsize=10)
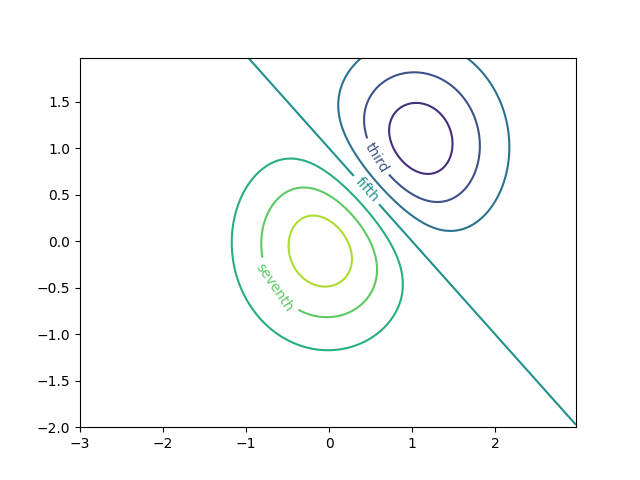
使用字典標記任意字串的等高線
fig1, ax1 = plt.subplots()

# Basic contour plot
CS1 = ax1.contour(X, Y, Z)

fmt = {}
strs = ['first', 'second', 'third', 'fourth', 'fifth', 'sixth', 'seventh']
for l, s in zip(CS1.levels, strs):
    fmt[l] = s

# Label every other level using strings
ax1.clabel(CS1, CS1.levels[::2], fmt=fmt, fontsize=10)
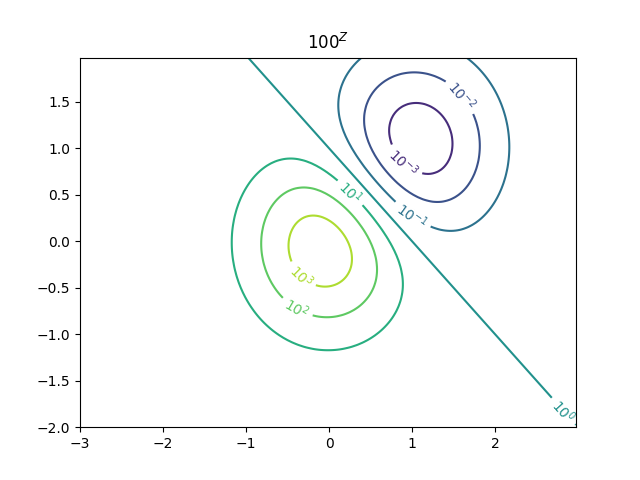
使用格式器
fig2, ax2 = plt.subplots()

CS2 = ax2.contour(X, Y, 100**Z, locator=plt.LogLocator())
fmt = ticker.LogFormatterMathtext()
fmt.create_dummy_axis()
ax2.clabel(CS2, CS2.levels, fmt=fmt)
ax2.set_title("$100^Z$")

plt.show()
參考文獻
此範例中顯示以下函式、方法、類別和模組的使用
腳本的總執行時間:(0 分鐘 3.484 秒)