注意
跳至末尾以下載完整範例程式碼。
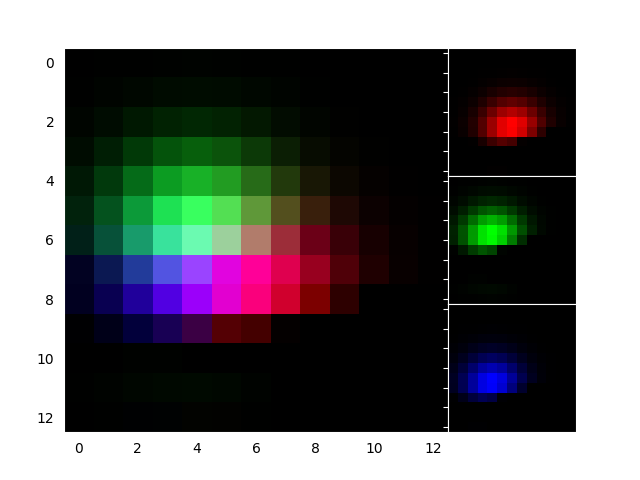
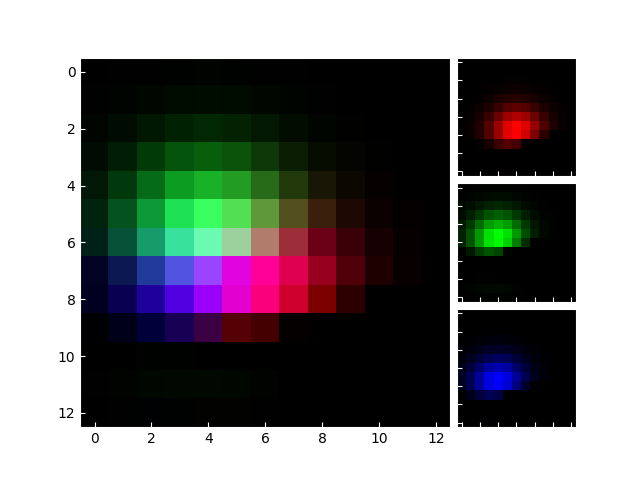
使用 RGBAxes 顯示 RGB 通道#
RGBAxes 建立 4 個軸的佈局,用於顯示 RGB 通道:一個用於 RGB 影像的大軸和 3 個用於 R、G、B 通道的小軸。
import matplotlib.pyplot as plt
import numpy as np

from matplotlib import cbook
from mpl_toolkits.axes_grid1.axes_rgb import RGBAxes, make_rgb_axes


def get_rgb():
    Z = cbook.get_sample_data("axes_grid/bivariate_normal.npy")
    Z[Z < 0] = 0.
    Z = Z / Z.max()

    R = Z[:13, :13]
    G = Z[2:, 2:]
    B = Z[:13, 2:]

    return R, G, B


def make_cube(r, g, b):
    ny, nx = r.shape
    R = np.zeros((ny, nx, 3))
    R[:, :, 0] = r
    G = np.zeros_like(R)
    G[:, :, 1] = g
    B = np.zeros_like(R)
    B[:, :, 2] = b

    RGB = R + G + B

    return R, G, B, RGB


def demo_rgb1():
    fig = plt.figure()
    ax = RGBAxes(fig, [0.1, 0.1, 0.8, 0.8], pad=0.0)
    r, g, b = get_rgb()
    ax.imshow_rgb(r, g, b)


def demo_rgb2():
    fig, ax = plt.subplots()
    ax_r, ax_g, ax_b = make_rgb_axes(ax, pad=0.02)

    r, g, b = get_rgb()
    im_r, im_g, im_b, im_rgb = make_cube(r, g, b)
    ax.imshow(im_rgb)
    ax_r.imshow(im_r)
    ax_g.imshow(im_g)
    ax_b.imshow(im_b)

    for ax in fig.axes:
        ax.tick_params(direction='in', color='w')
        ax.spines[:].set_color("w")


demo_rgb1()
demo_rgb2()

plt.show()
程式碼總執行時間: (0 分鐘 1.848 秒)