注意
前往結尾以下載完整的範例程式碼。
桑基圖類別#
透過產生三個基本圖表來示範桑基圖類別。
import matplotlib.pyplot as plt

from matplotlib.sankey import Sankey
範例 1 - 大部分預設值
這示範如何透過隱式呼叫 Sankey.add() 方法,並在類別呼叫中附加 finish() 來建立簡單的圖表。
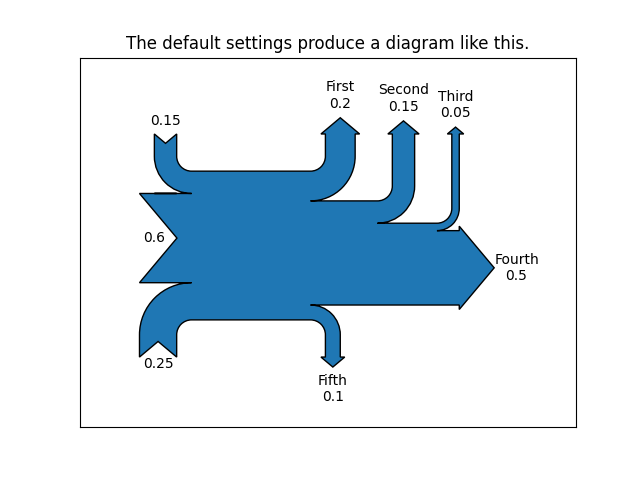
請注意
在執行個體化 Sankey() 時未提供軸,因此會自動建立軸。
由於資料已正規化,因此 scale 引數不是必要的。
預設情況下,路徑的長度是對齊的。
範例 2
這示範
將一個路徑設定為比其他路徑更長
將標籤放置在圖表的中心
使用 scale 引數來正規化流量
將關鍵字引數隱式傳遞給 PathPatch()
變更箭頭頭部的角度
變更路徑端點及其標籤之間的偏移量
格式化路徑標籤中的數字和相關單位
在建立圖表後變更修補程式和標籤的外觀
fig = plt.figure()
ax = fig.add_subplot(1, 1, 1, xticks=[], yticks=[],
                     title="Flow Diagram of a Widget")
sankey = Sankey(ax=ax, scale=0.01, offset=0.2, head_angle=180,
                format='%.0f', unit='%')
sankey.add(flows=[25, 0, 60, -10, -20, -5, -15, -10, -40],
           labels=['', '', '', 'First', 'Second', 'Third', 'Fourth',
                   'Fifth', 'Hurray!'],
           orientations=[-1, 1, 0, 1, 1, 1, -1, -1, 0],
           pathlengths=[0.25, 0.25, 0.25, 0.25, 0.25, 0.6, 0.25, 0.25,
                        0.25],
           patchlabel="Widget\nA")  # Arguments to matplotlib.patches.PathPatch
diagrams = sankey.finish()
diagrams[0].texts[-1].set_color('r')
diagrams[0].text.set_fontweight('bold')
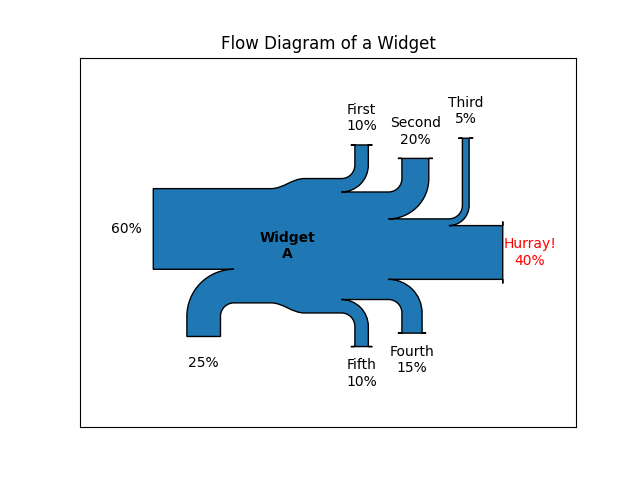
請注意
由於流量總和不為零,因此主幹的寬度不均勻。matplotlib 記錄系統會在 DEBUG 層級記錄此資訊。
第二個流量不會顯示,因為其值為零。同樣地,此資訊也會記錄在 DEBUG 層級。
範例 3
這示範
連接兩個系統
關閉數量的標籤
新增圖例
fig = plt.figure()
ax = fig.add_subplot(1, 1, 1, xticks=[], yticks=[], title="Two Systems")
flows = [0.25, 0.15, 0.60, -0.10, -0.05, -0.25, -0.15, -0.10, -0.35]
sankey = Sankey(ax=ax, unit=None)
sankey.add(flows=flows, label='one',
           orientations=[-1, 1, 0, 1, 1, 1, -1, -1, 0])
sankey.add(flows=[-0.25, 0.15, 0.1], label='two',
           orientations=[-1, -1, -1], prior=0, connect=(0, 0))
diagrams = sankey.finish()
diagrams[-1].patch.set_hatch('/')
plt.legend()
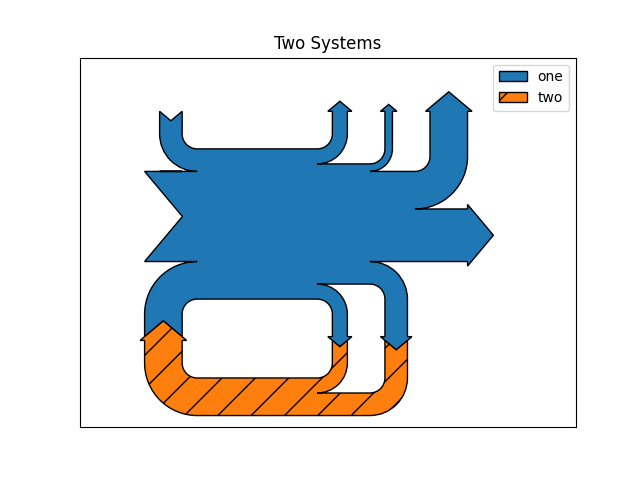
請注意,只指定了一個連接,但系統會形成一個迴路,因為:(1) 路徑的長度是對齊的,且 (2) 流量的方向和順序是對稱的。
plt.show()
參考
此範例中顯示了以下函數、方法、類別和模組的使用
腳本的總執行時間: (0 分鐘 1.510 秒)