注意
前往結尾下載完整範例程式碼。
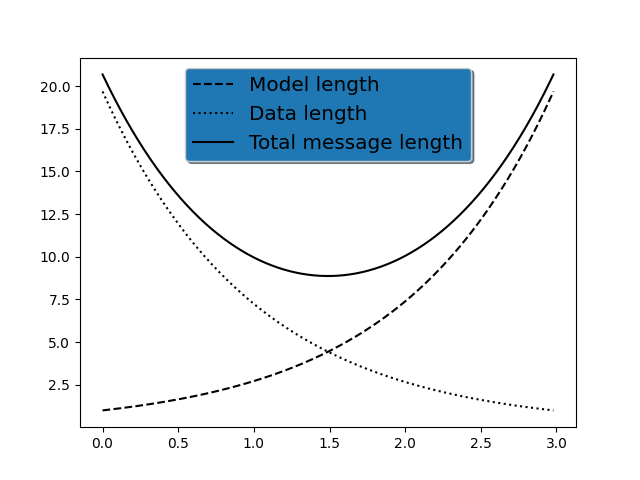
使用預先定義的標籤的圖例#
使用繪圖定義圖例標籤。
import matplotlib.pyplot as plt
import numpy as np

# Make some fake data.
a = b = np.arange(0, 3, .02)
c = np.exp(a)
d = c[::-1]

# Create plots with pre-defined labels.
fig, ax = plt.subplots()
ax.plot(a, c, 'k--', label='Model length')
ax.plot(a, d, 'k:', label='Data length')
ax.plot(a, c + d, 'k', label='Total message length')

legend = ax.legend(loc='upper center', shadow=True, fontsize='x-large')

# Put a nicer background color on the legend.
legend.get_frame().set_facecolor('C0')

plt.show()
參考
此範例顯示以下函數、方法、類別和模組的使用
腳本總執行時間: (0 分鐘 1.040 秒)