注意
前往結尾以下載完整的範例程式碼。
放置文字框#
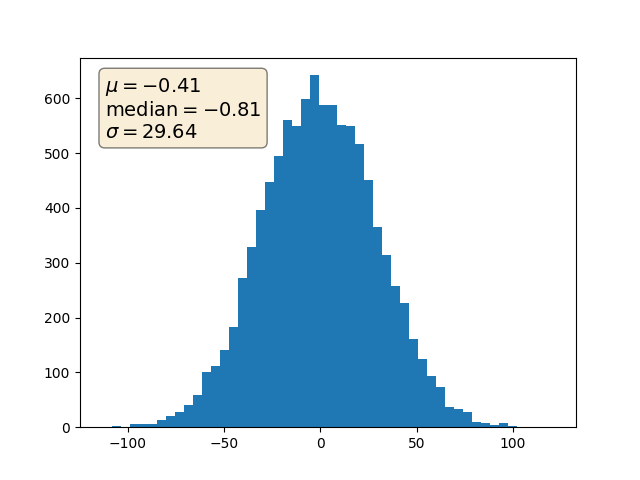
當使用文字框裝飾軸時,兩個有用的技巧是將文字放置在軸座標中(請參閱轉換教學),這樣文字就不會隨著 x 或 y 限制的變更而移動。您也可以使用文字的 bbox 屬性來使用 Patch 實例包圍文字 -- bbox 關鍵字引數接受一個包含 Patch 屬性索引的字典。
import matplotlib.pyplot as plt
import numpy as np

np.random.seed(19680801)

fig, ax = plt.subplots()
x = 30*np.random.randn(10000)
mu = x.mean()
median = np.median(x)
sigma = x.std()
textstr = '\n'.join((
    r'$\mu=%.2f$' % (mu, ),
    r'$\mathrm{median}=%.2f$' % (median, ),
    r'$\sigma=%.2f$' % (sigma, )))

ax.hist(x, 50)
# these are matplotlib.patch.Patch properties
props = dict(boxstyle='round', facecolor='wheat', alpha=0.5)

# place a text box in upper left in axes coords
ax.text(0.05, 0.95, textstr, transform=ax.transAxes, fontsize=14,
        verticalalignment='top', bbox=props)

plt.show()