注意
前往結尾 以下載完整的範例程式碼。
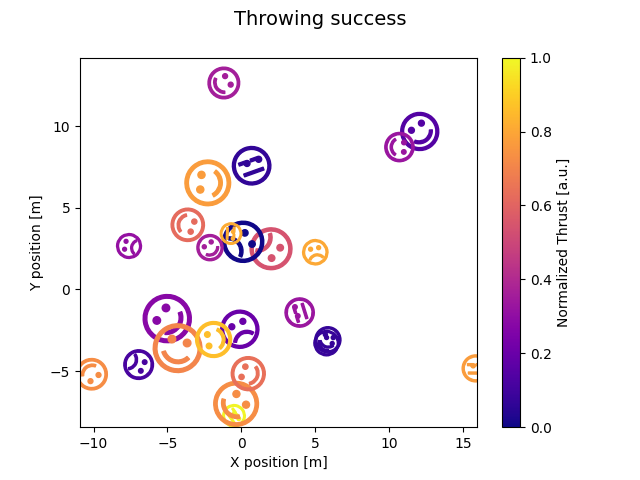
將標記屬性對應到多變數資料#
此範例示範如何使用標記的不同屬性來繪製多變數資料集。在這裡,我們將一次成功的棒球投擲表示為一個笑臉,其中標記大小對應於投擲者的技能,標記旋轉對應於起飛角度,推力對應於標記顏色。
import matplotlib.pyplot as plt
import numpy as np

from matplotlib.colors import Normalize
from matplotlib.markers import MarkerStyle
from matplotlib.text import TextPath
from matplotlib.transforms import Affine2D

SUCCESS_SYMBOLS = [
    TextPath((0, 0), "☹"),
    TextPath((0, 0), "😒"),
    TextPath((0, 0), "☺"),
]

N = 25
np.random.seed(42)
skills = np.random.uniform(5, 80, size=N) * 0.1 + 5
takeoff_angles = np.random.normal(0, 90, N)
thrusts = np.random.uniform(size=N)
successful = np.random.randint(0, 3, size=N)
positions = np.random.normal(size=(N, 2)) * 5
data = zip(skills, takeoff_angles, thrusts, successful, positions)

cmap = plt.colormaps["plasma"]
fig, ax = plt.subplots()
fig.suptitle("Throwing success", size=14)
for skill, takeoff, thrust, mood, pos in data:
    t = Affine2D().scale(skill).rotate_deg(takeoff)
    m = MarkerStyle(SUCCESS_SYMBOLS[mood], transform=t)
    ax.plot(pos[0], pos[1], marker=m, color=cmap(thrust))
fig.colorbar(plt.cm.ScalarMappable(norm=Normalize(0, 1), cmap=cmap),
             ax=ax, label="Normalized Thrust [a.u.]")
ax.set_xlabel("X position [m]")
ax.set_ylabel("Y position [m]")

plt.show()
腳本總執行時間: (0 分鐘 1.382 秒)