注意
前往末尾下載完整範例程式碼。
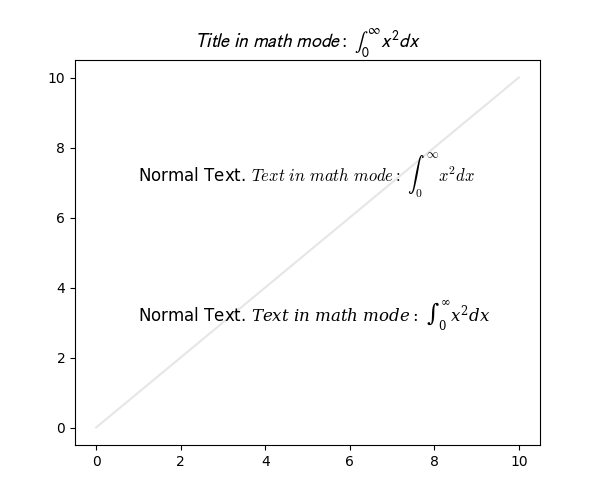
數學字型系列#
一個簡單的範例,展示了新的 math_fontfamily 參數,可用於更改圖表中每個文字元素的字型系列。
如果未設定任何參數,將使用全域值 rcParams["mathtext.fontset"] (預設:'dejavusans')。
import matplotlib.pyplot as plt

fig, ax = plt.subplots(figsize=(6, 5))

# A simple plot for the background.
ax.plot(range(11), color="0.9")

# A text mixing normal text and math text.
msg = (r"Normal Text. $Text\ in\ math\ mode:\ "
       r"\int_{0}^{\infty } x^2 dx$")

# Set the text in the plot.
ax.text(1, 7, msg, size=12, math_fontfamily='cm')

# Set another font for the next text.
ax.text(1, 3, msg, size=12, math_fontfamily='dejavuserif')

# *math_fontfamily* can be used in most places where there is text,
# like in the title:
ax.set_title(r"$Title\ in\ math\ mode:\ \int_{0}^{\infty } x^2 dx$",
             math_fontfamily='stixsans', size=14)

# Note that the normal text is not changed by *math_fontfamily*.
plt.show()
腳本的總執行時間:(0 分鐘 1.682 秒)