注意
前往結尾下載完整範例程式碼。
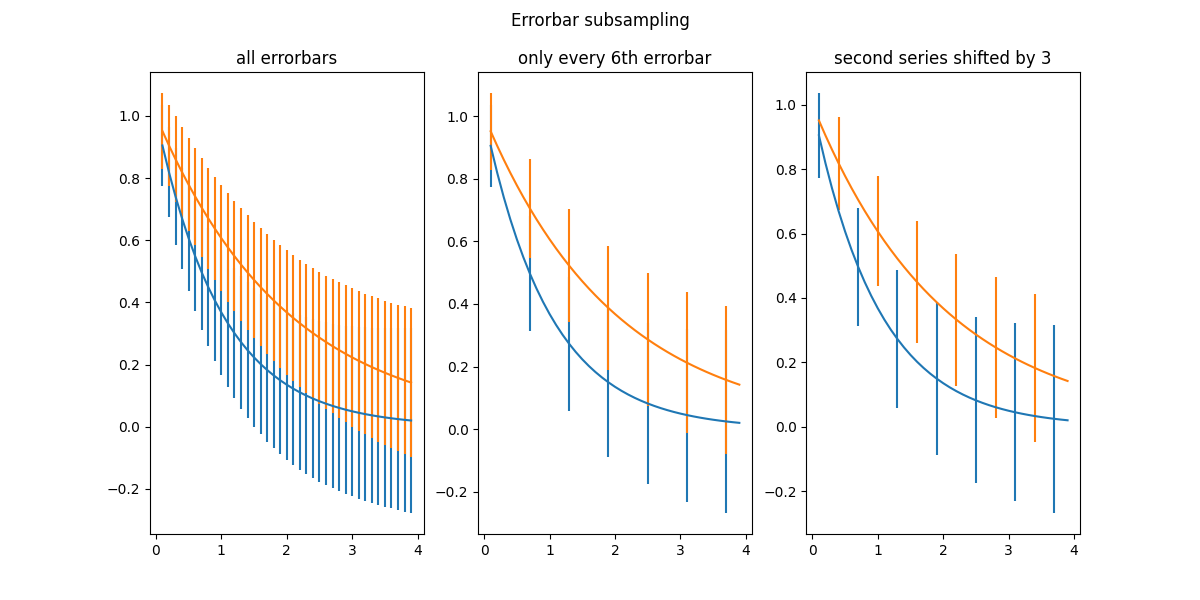
誤差棒子採樣#
Axes.errorbar 的參數 errorevery 可用於僅在資料點的子集上繪製誤差棒。如果有很多具有相似誤差的資料點,這特別有用。
import matplotlib.pyplot as plt
import numpy as np

# example data
x = np.arange(0.1, 4, 0.1)
y1 = np.exp(-1.0 * x)
y2 = np.exp(-0.5 * x)

# example variable error bar values
y1err = 0.1 + 0.1 * np.sqrt(x)
y2err = 0.1 + 0.1 * np.sqrt(x/2)


fig, (ax0, ax1, ax2) = plt.subplots(nrows=1, ncols=3, sharex=True,
                                    figsize=(12, 6))

ax0.set_title('all errorbars')
ax0.errorbar(x, y1, yerr=y1err)
ax0.errorbar(x, y2, yerr=y2err)

ax1.set_title('only every 6th errorbar')
ax1.errorbar(x, y1, yerr=y1err, errorevery=6)
ax1.errorbar(x, y2, yerr=y2err, errorevery=6)

ax2.set_title('second series shifted by 3')
ax2.errorbar(x, y1, yerr=y1err, errorevery=(0, 6))
ax2.errorbar(x, y2, yerr=y2err, errorevery=(3, 6))

fig.suptitle('Errorbar subsampling')
plt.show()
腳本的總執行時間:(0 分鐘 1.912 秒)