注意
前往結尾下載完整的範例程式碼。
在 pyplot 中管理多個圖表#
matplotlib.pyplot 使用目前圖表和目前軸的概念。圖表透過傳遞給 figure 的圖表編號來識別。具有給定編號的圖表會設定為目前圖表。此外,如果不存在具有該編號的圖表,則會建立一個新的圖表。
注意
我們不鼓勵透過隱式 pyplot 介面使用多個圖表,因為管理目前圖表既麻煩又容易出錯。相反地,我們建議使用明確的方法,並在 Figure 和 Axes 實例上呼叫方法。請參閱 Matplotlib 應用程式介面 (API),以了解隱式和顯式介面之間的取捨。
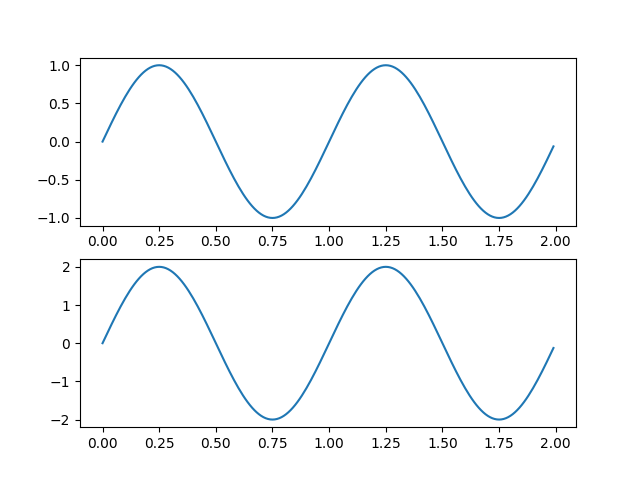
建立圖表 1
plt.figure(1)
plt.subplot(211)
plt.plot(t, s1)
plt.subplot(212)
plt.plot(t, 2*s1)
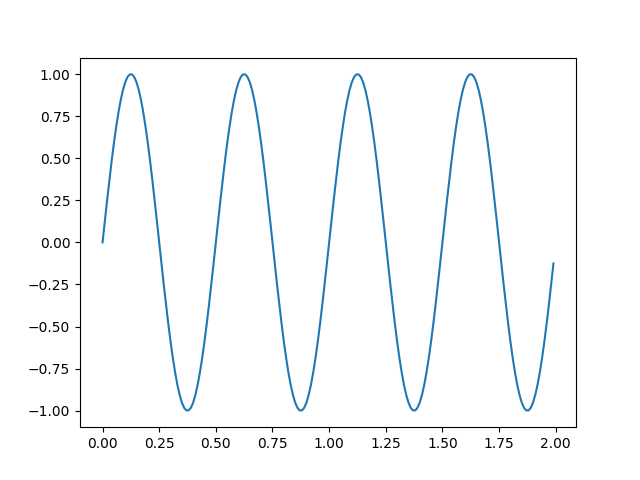
建立圖表 2
plt.figure(2)
plt.plot(t, s2)
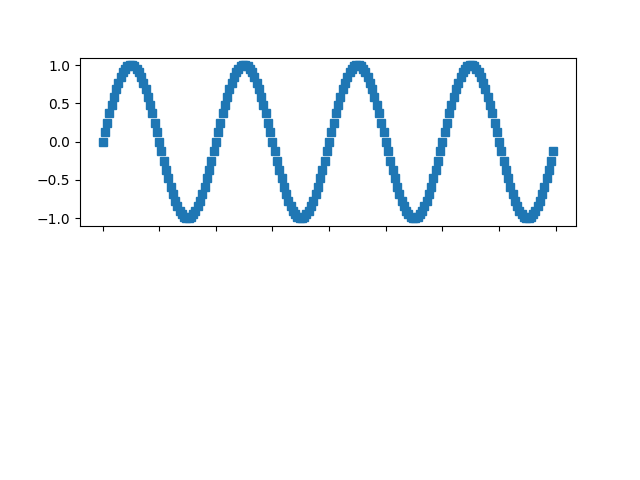
現在切換回圖表 1 並進行一些變更
plt.figure(1)
plt.subplot(211)
plt.plot(t, s2, 's')
ax = plt.gca()
ax.set_xticklabels([])

plt.show()
腳本的總執行時間:(0 分鐘 2.344 秒)