注意
前往結尾以下載完整的範例程式碼。
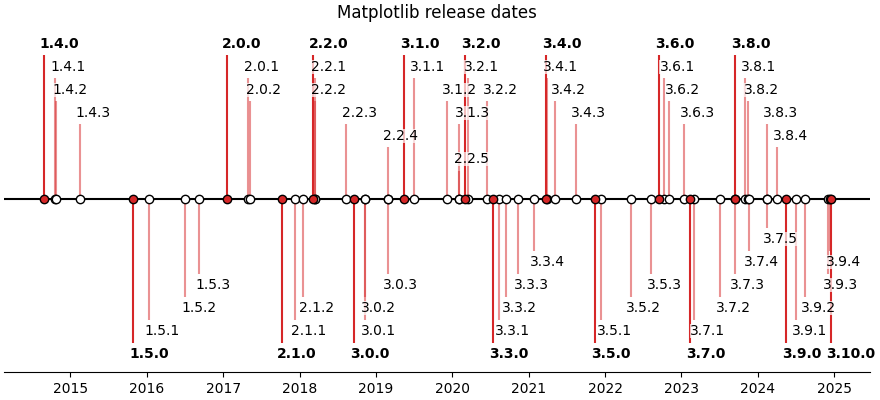
帶有線條、日期和文字的時間軸#
如何使用 Matplotlib 發行日期建立簡單的時間軸。
時間軸可以使用日期和文字的集合來建立。在此範例中,我們將展示如何使用 Matplotlib 近期發行版本的日期來建立簡單的時間軸。首先,我們將從 GitHub 擷取資料。
from datetime import datetime

import matplotlib.pyplot as plt
import numpy as np

import matplotlib.dates as mdates

try:
    # Try to fetch a list of Matplotlib releases and their dates
    # from https://api.github.com/repos/matplotlib/matplotlib/releases
    import json
    import urllib.request

    url = 'https://api.github.com/repos/matplotlib/matplotlib/releases'
    url += '?per_page=100'
    data = json.loads(urllib.request.urlopen(url, timeout=1).read().decode())

    dates = []
    releases = []
    for item in data:
        if 'rc' not in item['tag_name'] and 'b' not in item['tag_name']:
            dates.append(item['published_at'].split("T")[0])
            releases.append(item['tag_name'].lstrip("v"))

except Exception:
    # In case the above fails, e.g. because of missing internet connection
    # use the following lists as fallback.
    releases = ['2.2.4', '3.0.3', '3.0.2', '3.0.1', '3.0.0', '2.2.3',
                '2.2.2', '2.2.1', '2.2.0', '2.1.2', '2.1.1', '2.1.0',
                '2.0.2', '2.0.1', '2.0.0', '1.5.3', '1.5.2', '1.5.1',
                '1.5.0', '1.4.3', '1.4.2', '1.4.1', '1.4.0']
    dates = ['2019-02-26', '2019-02-26', '2018-11-10', '2018-11-10',
             '2018-09-18', '2018-08-10', '2018-03-17', '2018-03-16',
             '2018-03-06', '2018-01-18', '2017-12-10', '2017-10-07',
             '2017-05-10', '2017-05-02', '2017-01-17', '2016-09-09',
             '2016-07-03', '2016-01-10', '2015-10-29', '2015-02-16',
             '2014-10-26', '2014-10-18', '2014-08-26']

dates = [datetime.strptime(d, "%Y-%m-%d") for d in dates]  # Convert strs to dates.
releases = [tuple(release.split('.')) for release in releases]  # Split by component.
dates, releases = zip(*sorted(zip(dates, releases)))  # Sort by increasing date.
接下來,我們將建立一個莖圖,並在層次上做一些變化,以區分即使是緊鄰的事件。我們在基準線上新增標記,以視覺化強調時間軸的一維特性。
對於每個事件,我們透過 annotate 新增文字標籤,該標籤會從事件線的頂端以點為單位偏移。
請注意,Matplotlib 會自動繪製日期時間輸入。
# Choose some nice levels: alternate meso releases between top and bottom, and
# progressively shorten the stems for micro releases.
levels = []
macro_meso_releases = sorted({release[:2] for release in releases})
for release in releases:
    macro_meso = release[:2]
    micro = int(release[2])
    h = 1 + 0.8 * (5 - micro)
    level = h if macro_meso_releases.index(macro_meso) % 2 == 0 else -h
    levels.append(level)


def is_feature(release):
    """Return whether a version (split into components) is a feature release."""
    return release[-1] == '0'


# The figure and the axes.
fig, ax = plt.subplots(figsize=(8.8, 4), layout="constrained")
ax.set(title="Matplotlib release dates")

# The vertical stems.
ax.vlines(dates, 0, levels,
          color=[("tab:red", 1 if is_feature(release) else .5) for release in releases])
# The baseline.
ax.axhline(0, c="black")
# The markers on the baseline.
meso_dates = [date for date, release in zip(dates, releases) if is_feature(release)]
micro_dates = [date for date, release in zip(dates, releases)
               if not is_feature(release)]
ax.plot(micro_dates, np.zeros_like(micro_dates), "ko", mfc="white")
ax.plot(meso_dates, np.zeros_like(meso_dates), "ko", mfc="tab:red")

# Annotate the lines.
for date, level, release in zip(dates, levels, releases):
    version_str = '.'.join(release)
    ax.annotate(version_str, xy=(date, level),
                xytext=(-3, np.sign(level)*3), textcoords="offset points",
                verticalalignment="bottom" if level > 0 else "top",
                weight="bold" if is_feature(release) else "normal",
                bbox=dict(boxstyle='square', pad=0, lw=0, fc=(1, 1, 1, 0.7)))

ax.xaxis.set(major_locator=mdates.YearLocator(),
             major_formatter=mdates.DateFormatter("%Y"))

# Remove the y-axis and some spines.
ax.yaxis.set_visible(False)
ax.spines[["left", "top", "right"]].set_visible(False)

ax.margins(y=0.1)
plt.show()
參考資料
本範例中顯示了以下函式、方法、類別和模組的使用
腳本總執行時間: (0 分鐘 2.393 秒)