注意
前往結尾以下載完整範例程式碼。
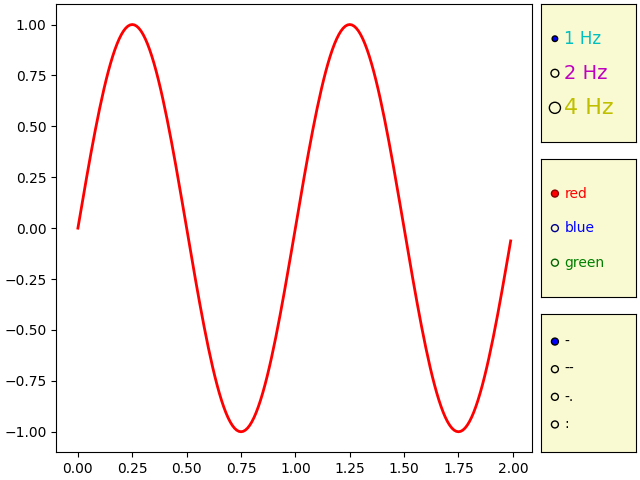
單選按鈕#
使用單選按鈕來選擇繪圖的屬性。
單選按鈕可讓您在視覺化中選擇多個選項。在此範例中,按鈕可讓使用者選擇要在圖表中顯示的三個不同正弦波之一。
單選按鈕可以使用 _label_props_ 和 _radio_props_ 參數進行樣式設定,每個參數都採用字典,其中包含藝術家屬性名稱的鍵和設定清單的值,且清單長度與按鈕數量相符。
import matplotlib.pyplot as plt
import numpy as np

from matplotlib.widgets import RadioButtons

t = np.arange(0.0, 2.0, 0.01)
s0 = np.sin(2*np.pi*t)
s1 = np.sin(4*np.pi*t)
s2 = np.sin(8*np.pi*t)

fig, ax = plt.subplot_mosaic(
    [
        ['main', 'freq'],
        ['main', 'color'],
        ['main', 'linestyle'],
    ],
    width_ratios=[5, 1],
    layout='constrained',
)
l, = ax['main'].plot(t, s0, lw=2, color='red')

radio_background = 'lightgoldenrodyellow'

ax['freq'].set_facecolor(radio_background)
radio = RadioButtons(ax['freq'], ('1 Hz', '2 Hz', '4 Hz'),
                     label_props={'color': 'cmy', 'fontsize': [12, 14, 16]},
                     radio_props={'s': [16, 32, 64]})


def hzfunc(label):
    hzdict = {'1 Hz': s0, '2 Hz': s1, '4 Hz': s2}
    ydata = hzdict[label]
    l.set_ydata(ydata)
    fig.canvas.draw()
radio.on_clicked(hzfunc)

ax['color'].set_facecolor(radio_background)
radio2 = RadioButtons(
    ax['color'], ('red', 'blue', 'green'),
    label_props={'color': ['red', 'blue', 'green']},
    radio_props={
        'facecolor': ['red', 'blue', 'green'],
        'edgecolor': ['darkred', 'darkblue', 'darkgreen'],
    })


def colorfunc(label):
    l.set_color(label)
    fig.canvas.draw()
radio2.on_clicked(colorfunc)

ax['linestyle'].set_facecolor(radio_background)
radio3 = RadioButtons(ax['linestyle'], ('-', '--', '-.', ':'))


def stylefunc(label):
    l.set_linestyle(label)
    fig.canvas.draw()
radio3.on_clicked(stylefunc)

plt.show()
腳本總執行時間: (0 分鐘 1.268 秒)