注意
移至結尾以下載完整的範例程式碼。
多個子圖#
具有多個子圖的簡單示範。
如需更多選項,請參閱使用 plt.subplots 建立多個子圖。
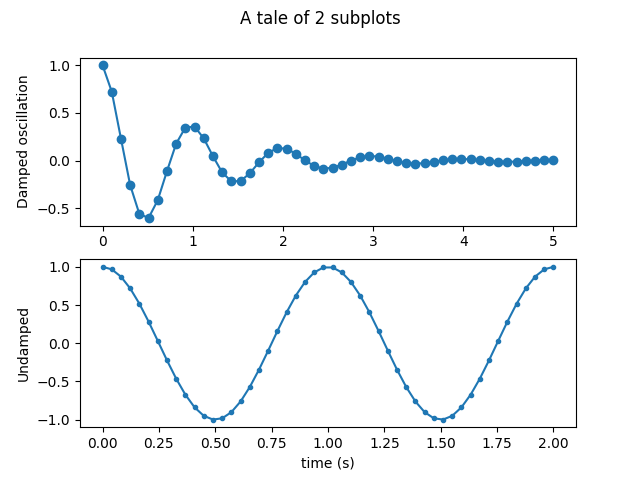
subplots()是產生簡單子圖排列的建議方法
fig, (ax1, ax2) = plt.subplots(2, 1)
fig.suptitle('A tale of 2 subplots')

ax1.plot(x1, y1, 'o-')
ax1.set_ylabel('Damped oscillation')

ax2.plot(x2, y2, '.-')
ax2.set_xlabel('time (s)')
ax2.set_ylabel('Undamped')

plt.show()
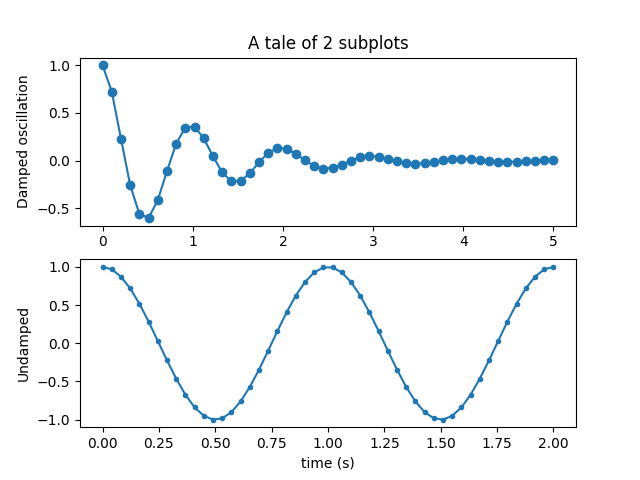
也可以使用subplot()一次產生一個子圖
plt.subplot(2, 1, 1)
plt.plot(x1, y1, 'o-')
plt.title('A tale of 2 subplots')
plt.ylabel('Damped oscillation')

plt.subplot(2, 1, 2)
plt.plot(x2, y2, '.-')
plt.xlabel('time (s)')
plt.ylabel('Undamped')

plt.show()
腳本的總執行時間:(0 分鐘 1.899 秒)