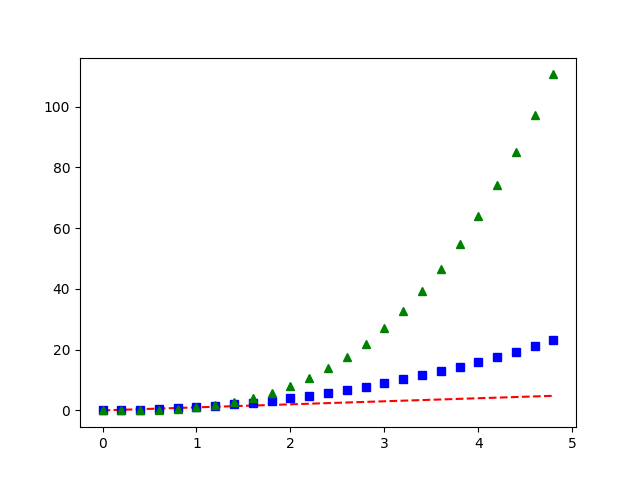
注意 跳到結尾以下載完整的範例程式碼。 使用 pyplot 繪製多條線條# 使用單次呼叫 plot 繪製三個資料集。 import matplotlib.pyplot as plt import numpy as np # evenly sampled time at 200ms intervals t = np.arange(0., 5., 0.2) # red dashes, blue squares and green triangles plt.plot(t, t, 'r--', t, t**2, 'bs', t, t**3, 'g^') plt.show() 參考 本範例顯示了以下函式、方法、類別和模組的使用 matplotlib.axes.Axes.plot / matplotlib.pyplot.plot 由 Sphinx-Gallery 產生的圖庫