注意
前往結尾以下載完整的範例程式碼。
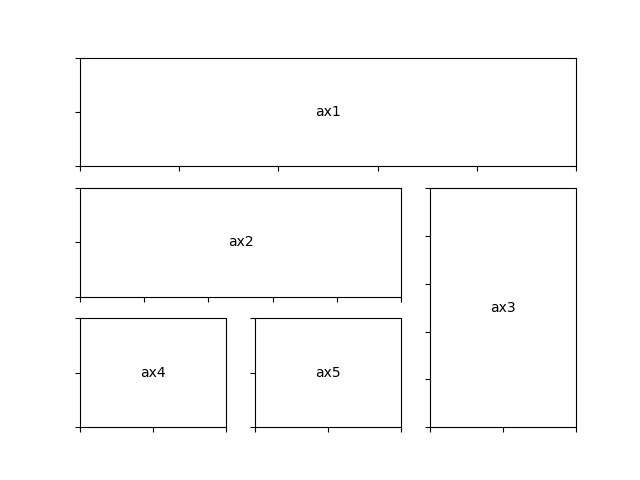
subplot2grid 演示#
這個範例示範如何使用 pyplot.subplot2grid 來產生子圖。一般來說,建議使用 GridSpec,如 GridSpec 演示 中所示。
import matplotlib.pyplot as plt


def annotate_axes(fig):
    for i, ax in enumerate(fig.axes):
        ax.text(0.5, 0.5, "ax%d" % (i+1), va="center", ha="center")
        ax.tick_params(labelbottom=False, labelleft=False)


fig = plt.figure()
ax1 = plt.subplot2grid((3, 3), (0, 0), colspan=3)
ax2 = plt.subplot2grid((3, 3), (1, 0), colspan=2)
ax3 = plt.subplot2grid((3, 3), (1, 2), rowspan=2)
ax4 = plt.subplot2grid((3, 3), (2, 0))
ax5 = plt.subplot2grid((3, 3), (2, 1))

annotate_axes(fig)

plt.show()