注意
前往結尾 以下載完整範例程式碼。
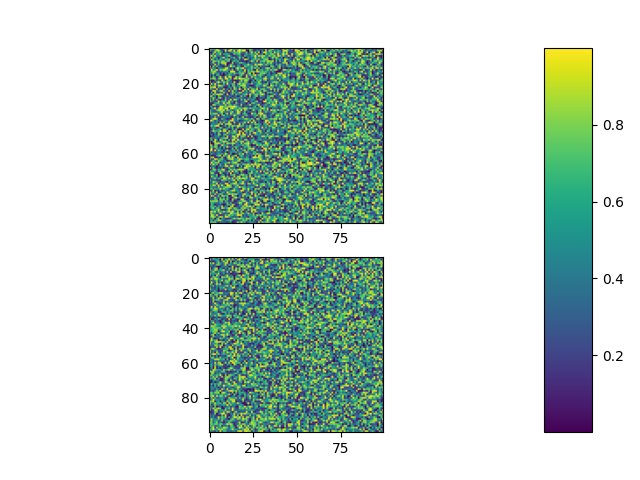
子圖間距和邊距#
使用 pyplot.subplots_adjust 調整邊距和子圖的間距。
注意
還有一個工具視窗可以互動式調整顯示圖形的邊距和間距。可以透過工具列或呼叫 pyplot.subplot_tool 來開啟。
import matplotlib.pyplot as plt
import numpy as np

# Fixing random state for reproducibility
np.random.seed(19680801)

plt.subplot(211)
plt.imshow(np.random.random((100, 100)))
plt.subplot(212)
plt.imshow(np.random.random((100, 100)))

plt.subplots_adjust(bottom=0.1, right=0.8, top=0.9)
cax = plt.axes((0.85, 0.1, 0.075, 0.8))
plt.colorbar(cax=cax)

plt.show()
腳本的總執行時間: (0 分鐘 1.193 秒)