注意
前往結尾以下載完整的範例程式碼。
SI 前綴偏移和自然數量級#
matplotlib.ticker.EngFormatter 能夠計算您的軸資料的自然偏移,並自動以標準 SI 前綴呈現。
以下是此類圖的範例
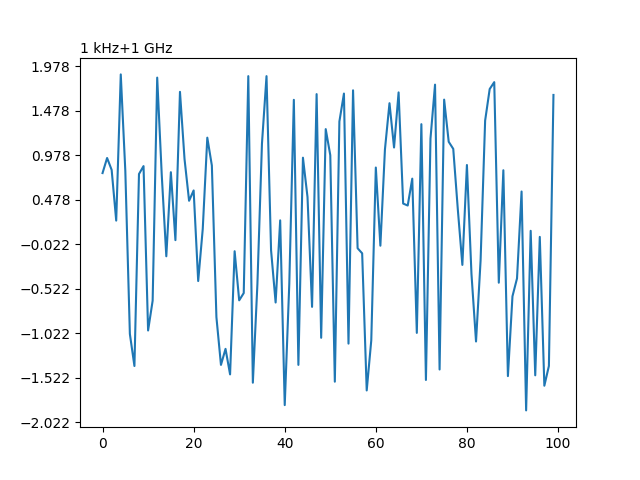
import matplotlib.pyplot as plt
import numpy as np

import matplotlib.ticker as mticker

# Fixing random state for reproducibility
np.random.seed(19680801)

UNIT = "Hz"

fig, ax = plt.subplots()
ax.yaxis.set_major_formatter(mticker.EngFormatter(
    useOffset=True,
    unit=UNIT
))
size = 100
measurement = np.full(size, 1e9)
noise = np.random.uniform(low=-2e3, high=2e3, size=size)
ax.plot(measurement + noise)
plt.show()
腳本總執行時間:(0 分鐘 1.134 秒)