注意
前往結尾下載完整範例程式碼。
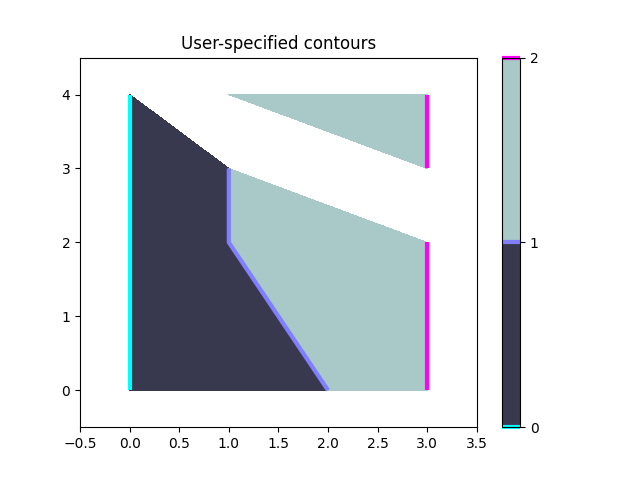
手動等高線#
使用 ContourSet 顯示自己的等高線和多邊形的範例。
import matplotlib.pyplot as plt

import matplotlib.cm as cm
from matplotlib.contour import ContourSet
from matplotlib.path import Path
每個水平的等高線都是多邊形的清單/元組。
兩個水平之間的填滿等高線也是多邊形的清單/元組。點可以順時針或逆時針排序。
fig, ax = plt.subplots()

# Filled contours using filled=True.
cs = ContourSet(ax, [0, 1, 2], [filled01, filled12], filled=True, cmap=cm.bone)
cbar = fig.colorbar(cs)

# Contour lines (non-filled).
lines = ContourSet(
    ax, [0, 1, 2], [lines0, lines1, lines2], cmap=cm.cool, linewidths=3)
cbar.add_lines(lines)

ax.set(xlim=(-0.5, 3.5), ylim=(-0.5, 4.5),
       title='User-specified contours')
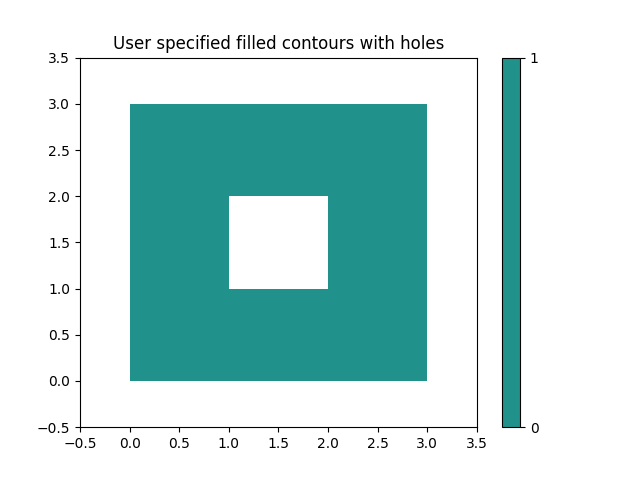
多個填滿的等高線可以在多邊形頂點的單個清單中指定,以及路徑類別中描述的頂點類型(程式碼類型)清單。這對於帶有孔洞的多邊形尤其有用。
fig, ax = plt.subplots()
filled01 = [[[0, 0], [3, 0], [3, 3], [0, 3], [1, 1], [1, 2], [2, 2], [2, 1]]]
M = Path.MOVETO
L = Path.LINETO
kinds01 = [[M, L, L, L, M, L, L, L]]
cs = ContourSet(ax, [0, 1], [filled01], [kinds01], filled=True)
cbar = fig.colorbar(cs)

ax.set(xlim=(-0.5, 3.5), ylim=(-0.5, 3.5),
       title='User specified filled contours with holes')

plt.show()
腳本的總執行時間:(0 分鐘 1.233 秒)