注意
跳到結尾以下載完整的範例程式碼。
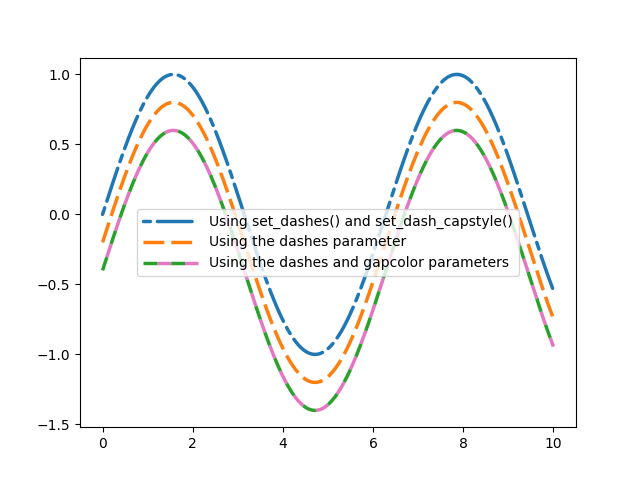
虛線樣式設定#
線條的虛線由虛線序列控制。可以使用 Line2D.set_dashes 進行修改。
虛線序列是一系列以點為單位的開/關長度,例如 [3, 1] 表示以 1 點間隔分隔的 3 點長線。
某些函數(例如 Axes.plot)支援將線條屬性作為關鍵字引數傳遞。在這種情況下,您可以在建立線條時設定虛線。
注意:虛線樣式也可以透過傳遞使用關鍵字 dashes 到循環器的虛線序列清單,透過 屬性循環 進行設定。此範例中未顯示。
虛線的其他屬性也可以使用相關方法(set_dash_capstyle、set_dash_joinstyle、set_gapcolor)或透過繪圖函數傳遞屬性來設定。
import matplotlib.pyplot as plt
import numpy as np

x = np.linspace(0, 10, 500)
y = np.sin(x)

plt.rc('lines', linewidth=2.5)
fig, ax = plt.subplots()

# Using set_dashes() and set_capstyle() to modify dashing of an existing line.
line1, = ax.plot(x, y, label='Using set_dashes() and set_dash_capstyle()')
line1.set_dashes([2, 2, 10, 2])  # 2pt line, 2pt break, 10pt line, 2pt break.
line1.set_dash_capstyle('round')

# Using plot(..., dashes=...) to set the dashing when creating a line.
line2, = ax.plot(x, y - 0.2, dashes=[6, 2], label='Using the dashes parameter')

# Using plot(..., dashes=..., gapcolor=...) to set the dashing and
# alternating color when creating a line.
line3, = ax.plot(x, y - 0.4, dashes=[4, 4], gapcolor='tab:pink',
                 label='Using the dashes and gapcolor parameters')

ax.legend(handlelength=4)
plt.show()
腳本的總執行時間:(0 分鐘 1.096 秒)